
Total Phase, Inc
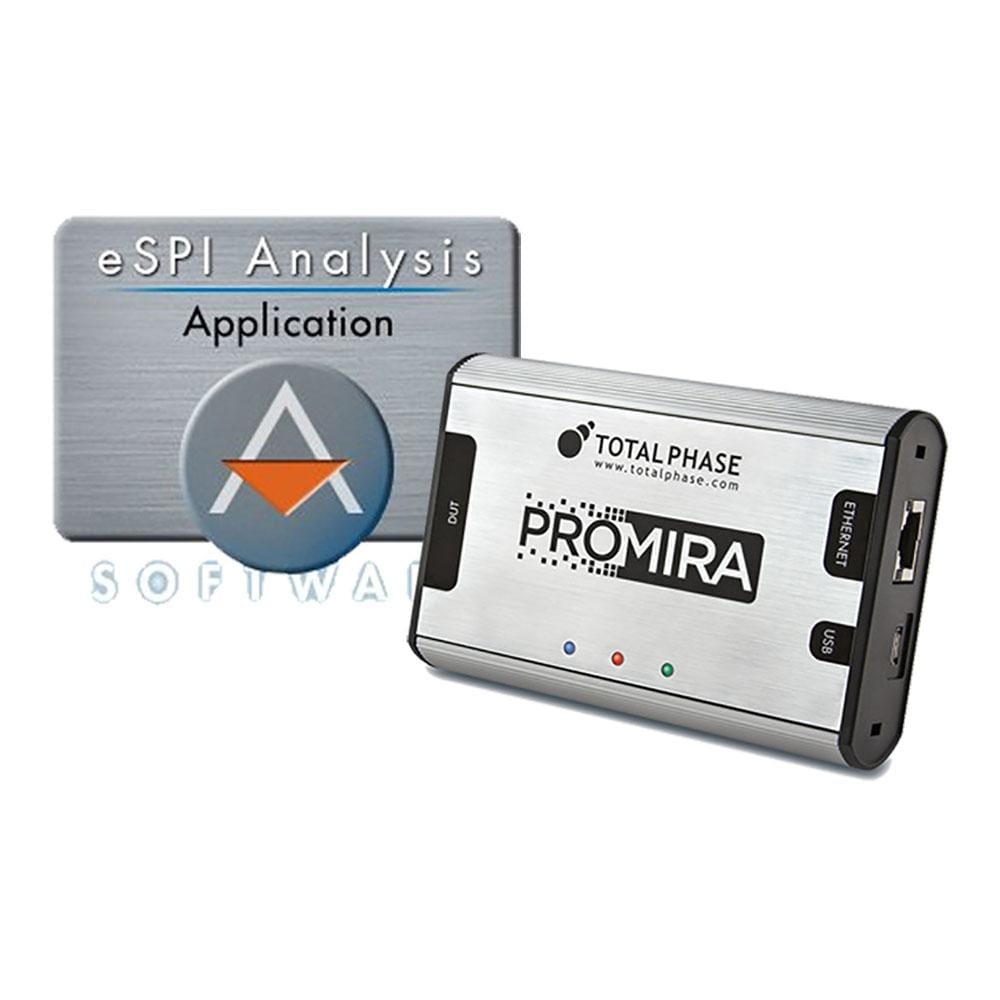
Total Phase PROMIRA eSPI Bus Analyser Kit
Total Phase PROMIRA eSPI Bus Analyser Kit
SKU: TP601100
Couldn't load pickup availability
Overview
The Total Phase eSPI Bus Monitor includes everything needed to Monitor and Analyse the Enhanced Serial Peripheral Interface (eSPI). The eSPI bus has been developed by Intel.
The eSPI Bus Analyser Kit includes the Total Phase PROMIRA™, a high-performance tool for stimulating and analysing serial buses, an eSPI Analysis, application, and the Data Centre Bus Analyser Software.
THIS PRODUCT IS NOT AVAILABLE FOR DELIVERY TO THE USA
Downloads
The Promira eSPI Bus Analyser Kit (TP601100) is a complete eSPI protocol analyser: a Total Phase Promira Serial Platform supplied with the eSPI Analysis Application, ready to monitor Enhanced Serial Peripheral Interface traffic at 20, 25, 33, 50 and 66 MHz in single, dual and quad I/O. It follows the peripheral, virtual wire, out-of-band and flash channels with two slave selects, two alert lines and two reset lines, and adds match triggers, hardware filters and statistics. It is the starting point for BIOS, embedded controller and BMC teams who need to see the eSPI link between a chipset and its EC, BMC or Super I/O.
One Order for Platform and eSPI Licence
The kit combines the Promira Serial Platform with the eSPI Analysis licence, so the analyser arrives ready for eSPI capture rather than as two separate purchases. The Promira connects to the analysis PC over USB 2.0 or Gigabit Ethernet, which lets it sit beside a platform in a validation lab while Data Center runs on a desk PC.
eSPI Capture to 66 MHz With Triggers and Filters
eSPI replaced the LPC bus on Intel platforms, and its traffic needs a dedicated eSPI protocol analyser rather than an SPI one. The kit captures every supported eSPI clock rate up to 66 MHz across single, dual and quad I/O, decodes the initialisation handshake and channel negotiation, and reports both correct and incorrect CRC values for command and response phases. Match triggers start a capture on the transaction that matters, hardware filters drop traffic you do not need, and hardware statistics counters summarise the traffic.
Grows With the Rest of the Promira Range
The platform in the kit is the same Promira that runs the I2C and SPI applications. Add an SPI Active licence and Total Phase's eSPI Active example files let the same unit send eSPI commands to a target as a master; Total Phase recommends SPI Active Level 3 for full eSPI performance at 66 MHz quad I/O. I2C and SPI analysis and host-adapter licences can be added to the same unit later.
Specifications
| Function | eSPI bus monitor (Analysis), non-intrusive |
|---|---|
| Clock rates | 20, 25, 33, 50 and 66 MHz |
| I/O modes | Single, dual and quad I/O |
| Channels | Peripheral, virtual wire, OOB, flash |
| Monitored control lines | 2 slave selects, 2 alert lines, 2 reset lines |
| Capture tools | Match triggers, hardware filters, statistics, CRC reporting |
| Signal level | 1.8 V I/O |
| Target connector | 2x17 IDC with 34-pin ribbon cable |
| Host interfaces | USB 2.0 and Gigabit Ethernet |
| Software | Data Center 6.62 or later; Promira Software API eSPI Analysis (C, C#, Python, .NET, VB.NET, VB6), free |
| Operating systems | Windows 10 and 11, Linux, macOS 13 or later |
| Order code | TP601100 (Debug Store kit of TP500110 and TP601010) |
Limitations
- eSPI I/O runs at 1.8 V, the eSPI norm. If your target runs eSPI at 3.3 V, contact us before ordering.
- The eSPI Analysis Application monitors only. Acting as an eSPI master needs an SPI Active licence as well.
Kit or Licence?
| Promira eSPI Bus Analyser Kit | eSPI Analysis Application | |
|---|---|---|
| Order code | TP601100 (Debug Store kit) | TP601010 |
| Contents | Promira Serial Platform with the eSPI Analysis application | Licence for an existing Promira |
| Price ex VAT | £2,130 | £1,215 |
Choose the kit if you do not yet own a Promira; it is £2,130 ex VAT, and the platform and licence bought separately total £2,255 ex VAT. If you already use a Promira for I2C or SPI, add eSPI with the licence alone.
Typical Applications
Tracing virtual wire and OOB traffic between a PCH and an embedded controller during S3 and S5 transitions. Debugging BMC firmware that misses an eSPI alert during boot. Verifying flash channel accesses on a platform where the EC shares the BIOS flash.
The kit suits BIOS and EC firmware engineers, platform validation teams and BMC developers bringing up Intel eSPI designs.
Order the Promira eSPI Bus Analyser Kit from £2,130 ex VAT. For a formal quotation, request a quote from our team.
Frequently Asked Questions
What is in the kit?
A Promira Serial Platform with the eSPI Analysis Application licence. Data Center and the Promira Software API are free downloads from Total Phase.
What eSPI clock rates does it capture?
20, 25, 33, 50 and 66 MHz, in single, dual and quad I/O.
Can it monitor a 3.3 V eSPI bus?
The analyser is specified for 1.8 V eSPI I/O. Contact us with your target details before ordering for a 3.3 V bus.
Can I use the same Promira for I2C and SPI?
Yes. Add the I2C or SPI Active or Analysis applications to the same unit; a Promira can hold more than one application licence.
Last reviewed 5 October 2026.
Questions and Answers
-
What Operating Systems Are Compatible with the eSPI Analysis Application?
Windows, Linux and Mac OS X, via the Data Center Software. -
How Do I Filter or Search for Specific Traffic or Events on the eSPI Bus?
You can use LiveFilter to filter by indices, errors, endpoints, device addresses, PIDs, and patterns. LiveSearch allows searching for text, hex, or ASCII data to easily locate events. -
Can the eSPI Analyser Capture and Organize Complex Transactions for Easier Debugging?
Yes. Captured data is shown in a hierarchical tree view, with transactions grouped and expandable for easier navigation. -
Does the Analyser Support Triggering or Match-action Features for Capturing Precise Conditions?
Yes, the tool has advanced match/trigger options. You can configure triggers for non-posted transactions, errors, or specific data patterns using the Match/Action system. -
Is There an API for Integrating the eSPI Analyser with Custom Test Setups?
Yes, a 32/64-bit software API is available for C, C#, Python, .NET, and VB.NET, allowing custom integration and automation of tests or analysis tasks. -
What Is the Total Phase eSPI Analyser, and What Does It Do?
It's a protocol analysis application that runs on the Promira Serial Platform. It non-intrusively captures, displays and monitors Enhanced Serial Peripheral Interface (eSPI) traffic between master and slave devices in real time. -
Which eSPI Features and Modes Are Supported?
The Analyser supports Single, Dual, and Quad I/O modes, monitoring at speeds up to 66MHz. It tracks all eSPI transaction types and phases, including command, turn-around, and response, as defined by the eSPI specification. -
Does the eSPI Analyser Support Real-time Analysis?
Yes. LiveDisplay, LiveFilter and LiveSearch in the Data Center Software let you view, filter and search eSPI traffic in real time as it's captured.

No questions match your search.