
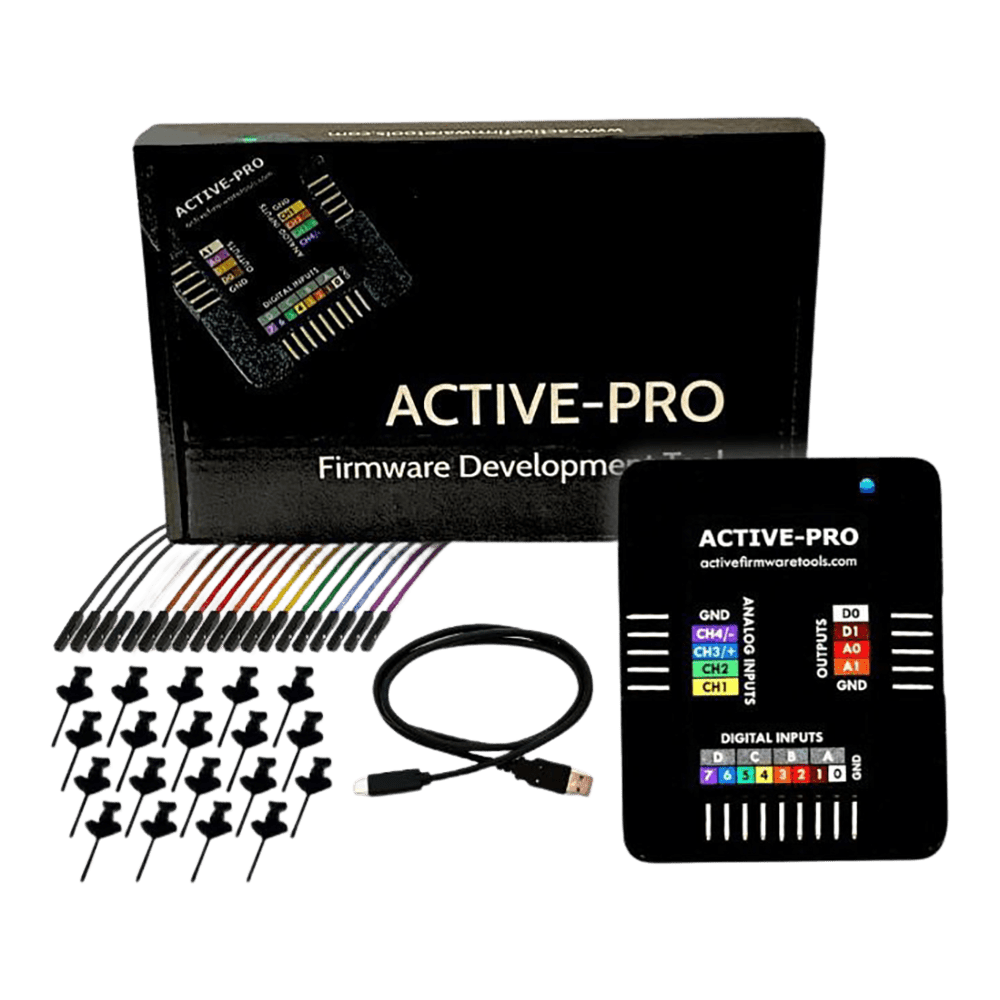
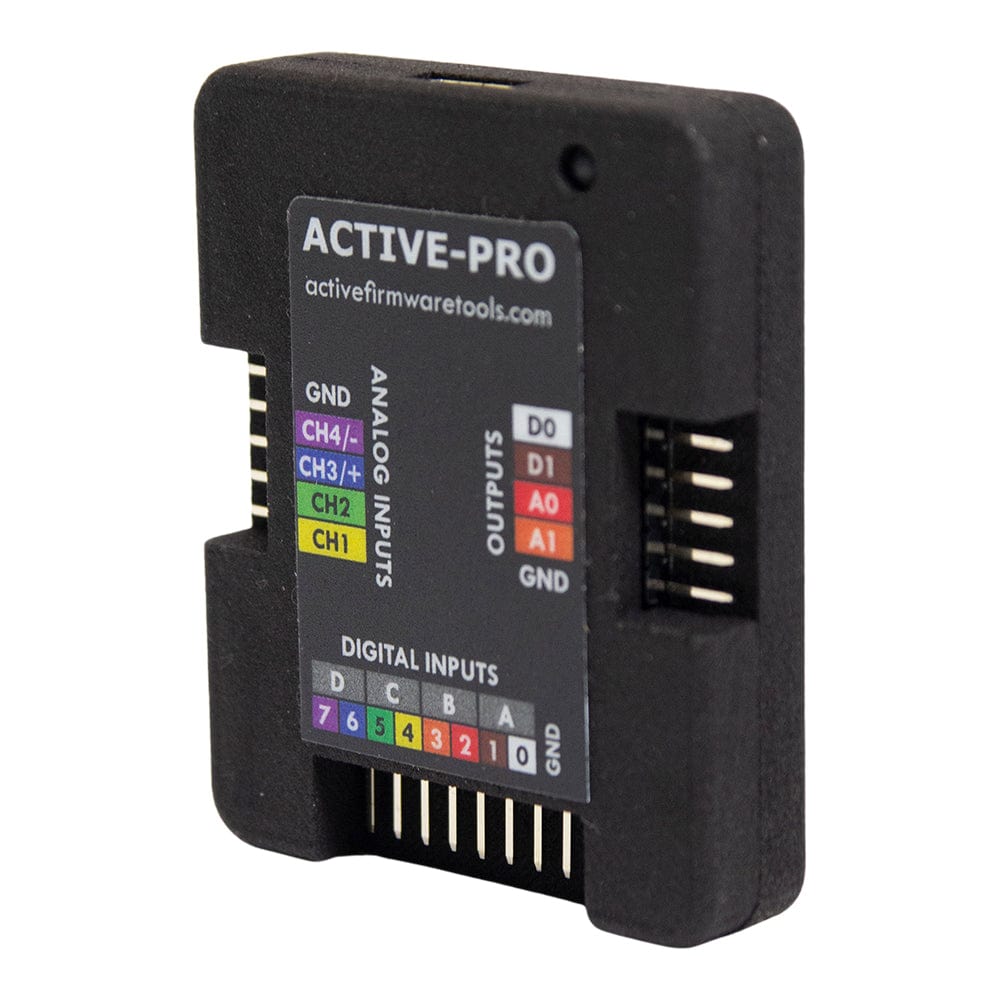
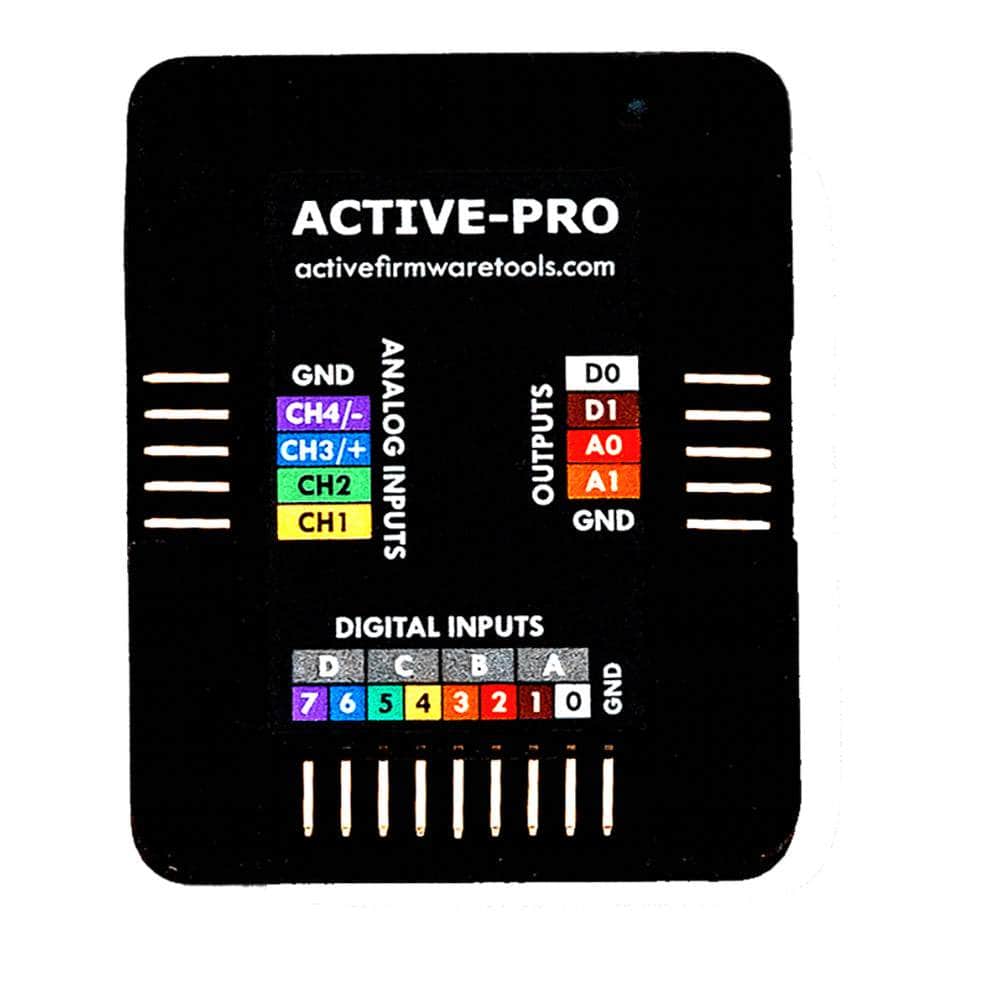
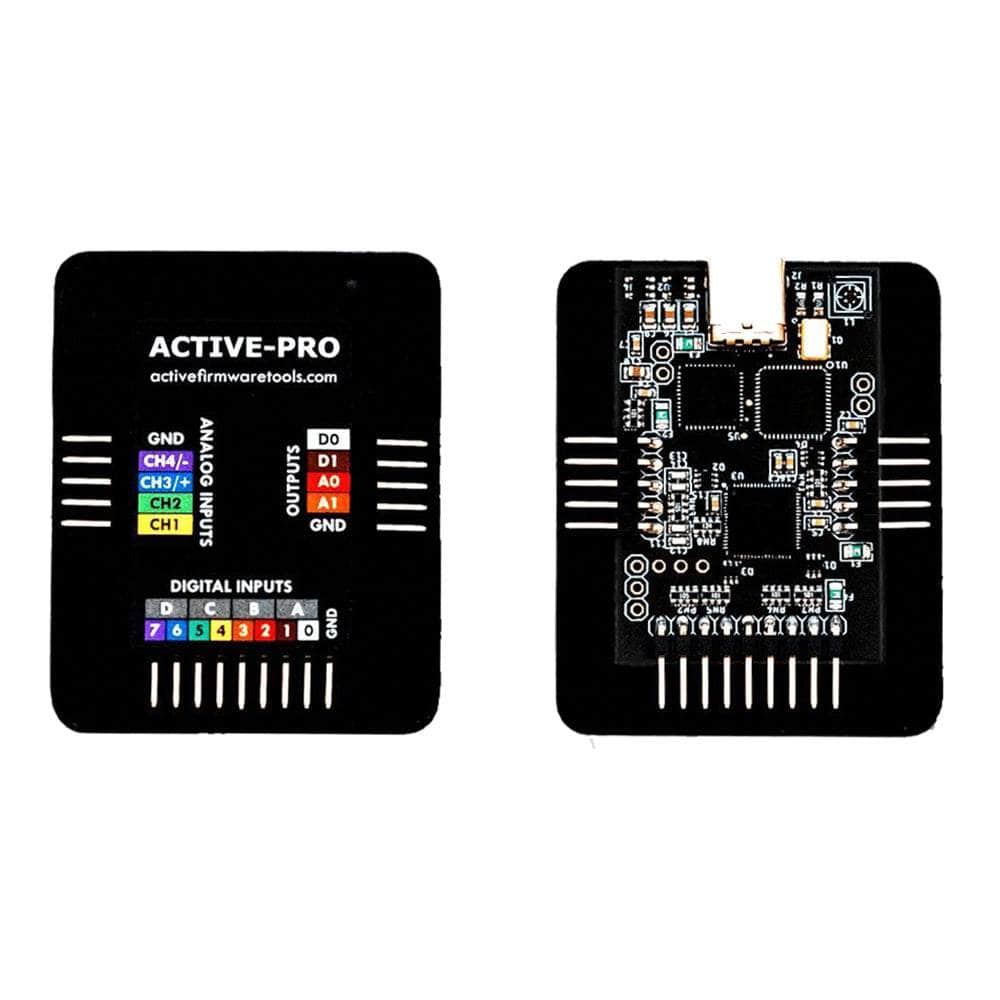
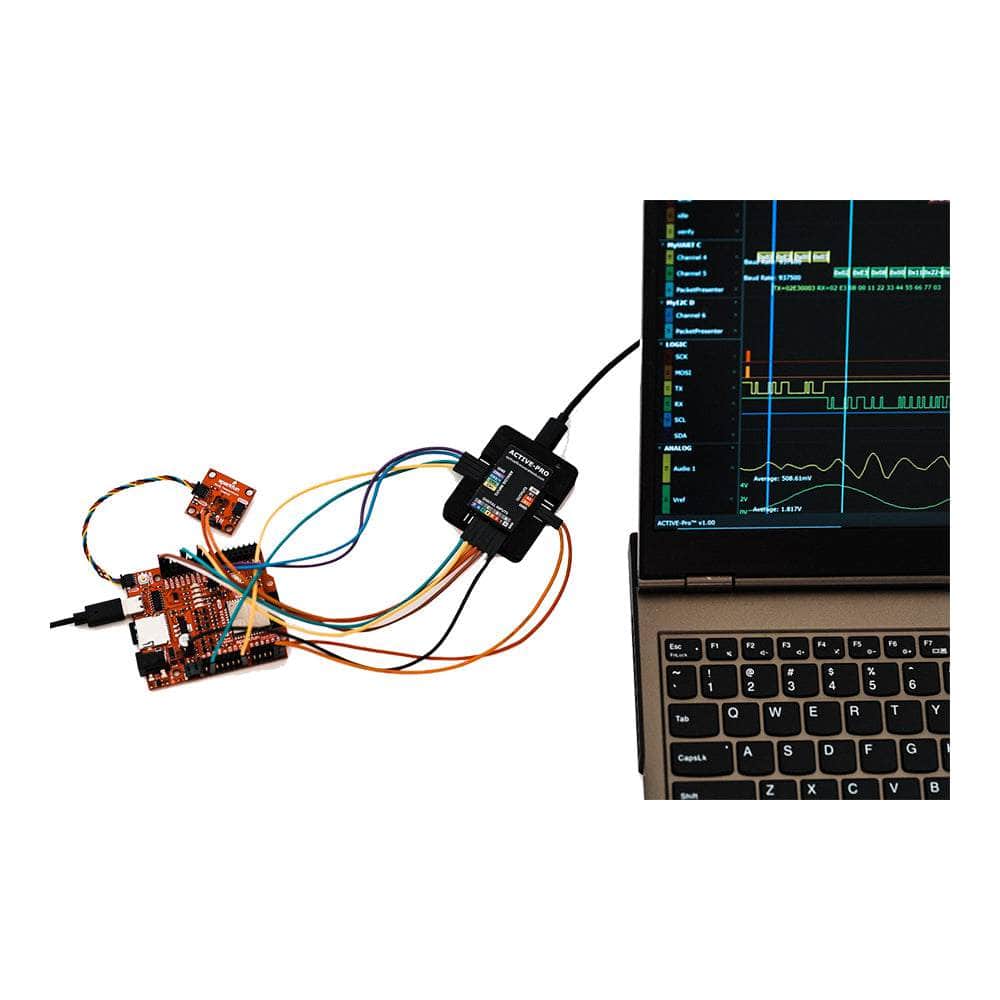
Active Firmware Tools
Active-Pro Firmware Debugger
Active-Pro Firmware Debugger
SKU: AP-FD
Couldn't load pickup availability
Key Features
Overview
Say goodbye to the frustrations of debugging your embedded firmware systems with the innovative Active-Pro Firmware Debugger. This powerful tool has been designed to streamline your debugging process, allowing you to focus on what really matters – developing robust firmware solutions.
The Active-Pro Firmware Debugger offers a comprehensive debugging experience with a new, user-friendly interface that simplifies your workflow. It provides clear, concise insights into your design's operation, enabling you to spot and rectify bugs with ease and efficiency.
Key features include:
- Multi-Protocol Support: The Active-Pro captures and displays a range of data types, including Logic Analyzer digital data, Oscilloscope analogue data, and easily decodes protocols such as I2C, SPI, and UART.
- Real-Time Data Streaming: This remarkable debugger streams data directly to disk, allowing you to capture and store data for persistent bug tracking and quicker debugging sessions.
One of the standout aspects of the Active-Pro Firmware Debugger is its simple connection options. Utilising either a 1-wire (UART) or 2-wire (GPIO) interface, it works seamlessly with various programming languages such as C, C++, and Python. With straightforward output calls, accessing critical data directly from your firmware has never been easier.
You can investigate your system's internal data without depending on external buses, giving you a unique view of your firmware’s operation. Moreover, the Active-Pro allows for simultaneous debugging of up to four MCUs, making it an invaluable addition to your embedded systems toolkit.
Invest in the Active-Pro Firmware Debugger today and elevate your debugging capabilities to new heights. Say goodbye to the endless hours of troubleshooting and hello to efficient, effective debugging that unleashes your creativity and innovation.
Downloads
Why Engineers Choose The Active-Pro Firmware Debugger
| General Information | |
|---|---|
Part Number (SKU) |
AP-FD
|
Manufacturer |
|
| Physical and Mechanical | |
Weight |
1.0 kg
|
| Other | |
EAN |
5055383697243
|
Questions and Answers
-
Can the Active-Pro Debugger Work with Any Microcontroller or FPGA Platform?
Yes. Active Firmware Tools states it works on any processor or FPGA. Libraries are available for C, C++ and Python (and Verilog/VHDL for FPGAs), and the target connects through a simple 1-wire (UART) or 2-wire (GPIO) interface, so one tool covers different microcontroller families and development environments.
-
How Does Real-Time Debugging Without Code Halting Benefit Embedded System Development?
Halting code changes timing, so step-through debuggers can miss timing bugs and race conditions. Debugging without halting shows genuine behaviour in timing-critical, real-time and multi-processor systems, where stopping one processor can affect the whole system.
With the Active-Pro you observe interrupt responses, communication timing and inter-processor interactions as they happen, including issues that only appear during continuous operation or under specific timing conditions.
-
How Does the Active-Pro's Packet Presenter Feature Make Debugging More Efficient?
Packet Presenter decodes communication protocols automatically and shows the data in human-readable form.
Instead of reading hex values, you see start/stop conditions, read/write operations, register addresses and data values. Up to 63 packet fields can be graphed in real time. This cuts the time spent on manual protocol analysis.
-
What Is the Active-Pro Firmware Debugger and How Does It Differ From Traditional JTAG Debuggers?
The Active-Pro is a multi-processor debugging tool that combines real-time firmware debugging, logic analysis, oscilloscope functions and hardware bus decoding in one device.
Traditional JTAG debuggers halt code execution. The Active-Pro lets firmware run continuously while it streams debug data from up to four microcontrollers at once. Through its Active Debug interface, your firmware outputs variables, state changes and custom messages with simple printf statements, with nanosecond-precision timestamps and no interruption to real-time operation.
-
How Many Microcontrollers Can the Active-Pro Debug Simultaneously?
Up to four processors or FPGAs at once (channels A, B, C and D). Each device supports up to 64 debug channels. You see real-time interactions and data flow between processors on a single synchronised timeline.
-
What Protocols Does the Active-Pro Hardware Bus Decoder Support?
These are decoded in hardware at 240Msps:
- I2C and SPI, with automatic signal detection
- UART/ASYNC (8-bit), with automatic baud rate detection
- the ACTIVE Debugger and EE101 Debugger interfaces, with automatic signal detection
1-Wire, MDIO, LIN, CHSI, RS232 and DS101 are decoded in software, and custom Python decoders cover other protocols.
-
How Does the Active-Pro's Sample Buffer Depth Compare to Traditional Logic Analysers?
Buffer depth is over 4 trillion samples, limited only by free disk space on the connected PC.
With lossless compression, captures run far longer than on traditional handheld logic analysers. For example, capturing 1MHz I2C register reads every 10 milliseconds records for about 383,000 seconds (4.4 days) per gigabyte. This helps with intermittent faults and long-term behaviour analysis.
No questions match your search.