
SEGGER Microcontroller GmbH
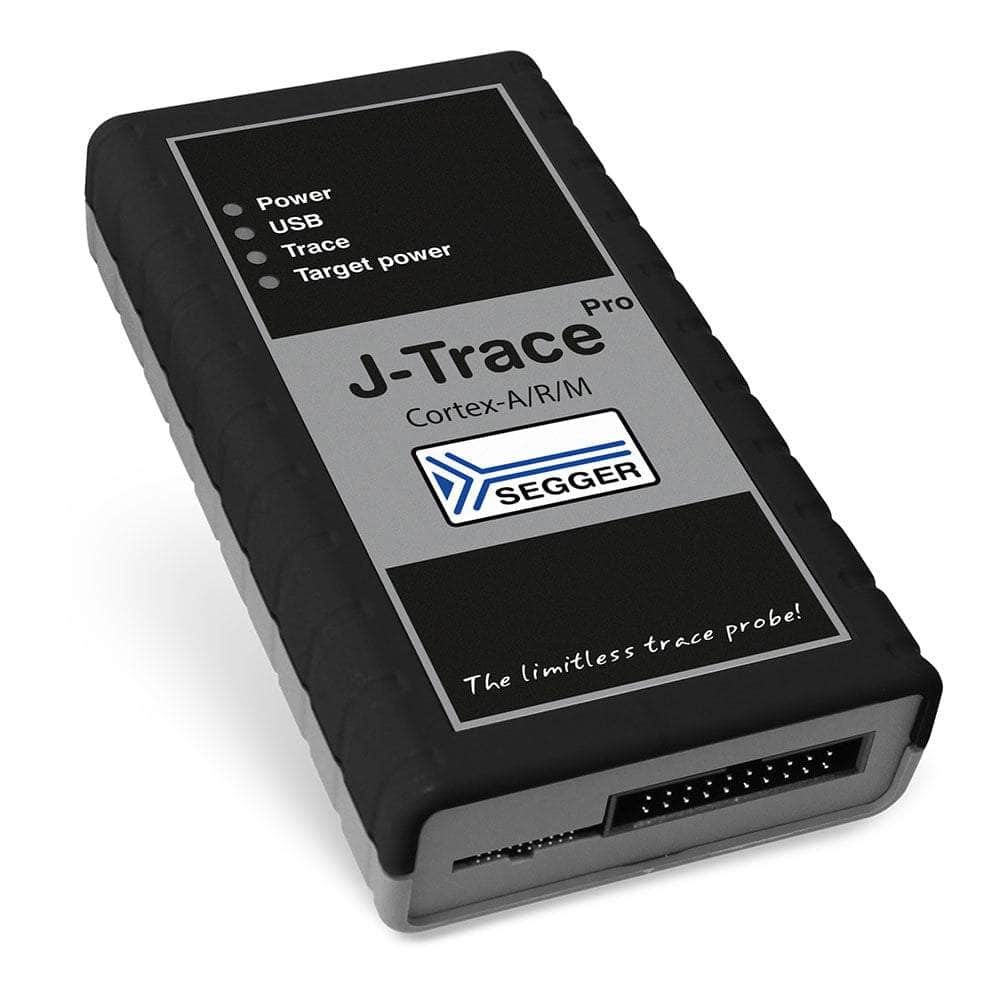
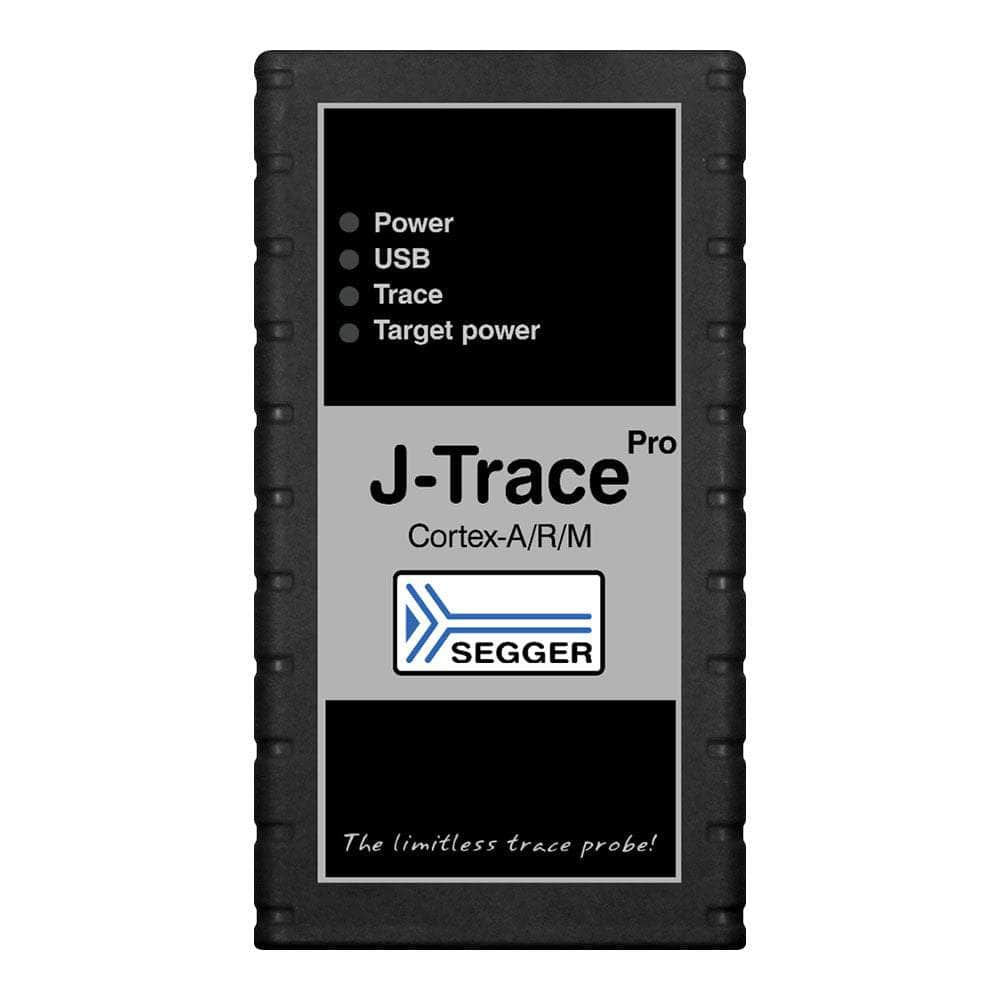
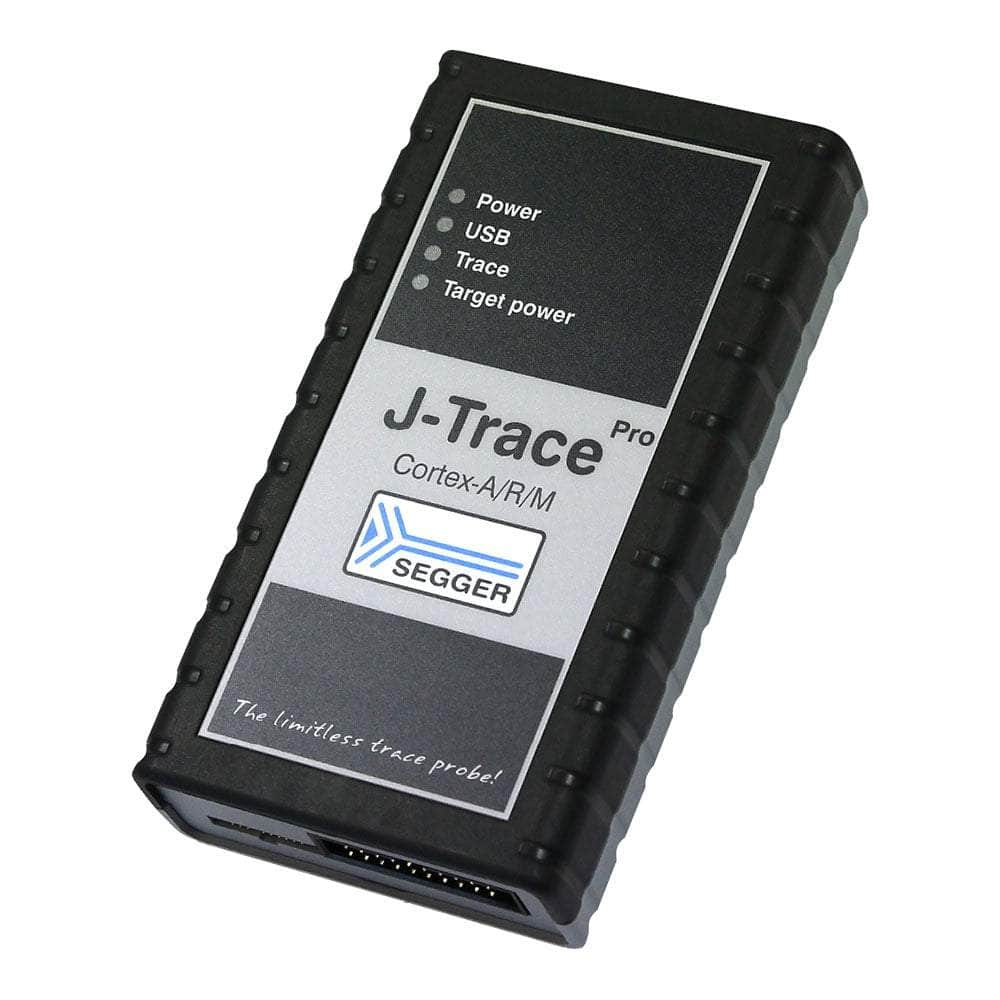
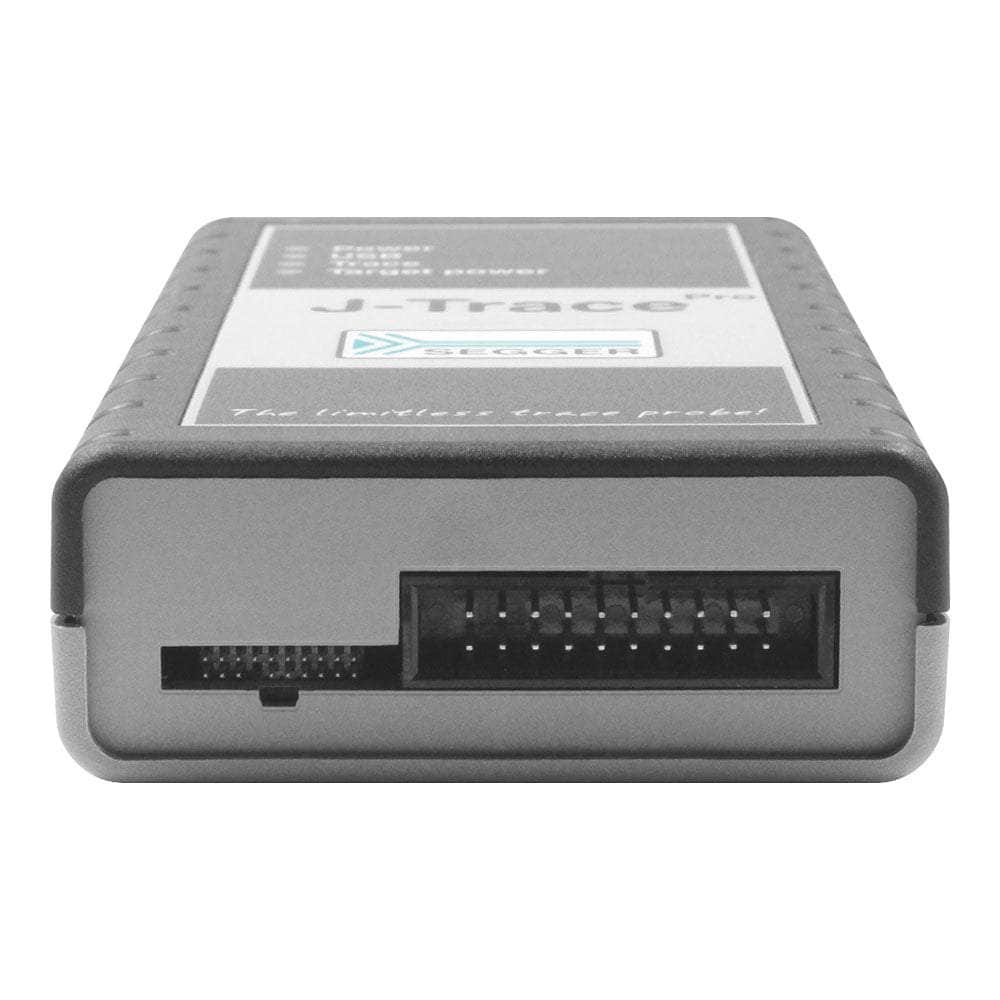
SEGGER J-Trace PRO Cortex Trace Debugger
SEGGER J-Trace PRO Cortex Trace Debugger
SKU: 8.20.00
Couldn't load pickup availability
Key Features
Overview
Unleash the Power of SuperSpeed Trace Probe for Cortex-A/R/M Microcontrollers
Upgrade your development experience with the J-Trace PRO Cortex, the cutting-edge trace probe designed to provide unparalleled support for Cortex-A/R/M-based microcontrollers. Unlock the full potential of your projects and optimize your code like never before!
Continuous Streaming Trace with USB 3.0 Interface
Say goodbye to data transmission bottlenecks! J-Trace PRO Cortex boasts a superspeed USB 3.0 interface that enables seamless continuous streaming trace via USB, with full trace clock support. This means no more limitations from internal buffers and a faster data transmission rate, empowering developers with critical insights to fine-tune their applications.
Capture Complete Traces Over Extended Periods
Don't let elusive bugs slow you down! With J-Trace PRO, you can capture complete traces over long periods, allowing you to record infrequent and hard-to-reproduce bugs. This feature is particularly helpful when the program flow derails and stops in a fault state, giving you the tools to diagnose and resolve issues quickly.
SuperSpeed USB 3.0 Driven Debug Probe with 64 MB On-Board Trace BufferExperience lightning-fast download speeds with the J-Trace PRO Cortex. With up to 4.0 MB/s download speed and a generous 64 MB onboard trace buffer, you can work efficiently without any compromises.
Unmatched Features for Unparalleled Performance
The J-Trace PRO Cortex is not just a trace probe; it's a comprehensive solution for your development needs. It comes loaded with an array of powerful features:
Real-time streaming at full System Clock for instant feedback on your application's performance. Live profiling to fine-tune your application for optimal execution.
Instruction-level code coverage to meet regulatory requirements and gain visibility into executed code segments. Unlimited trace support for isolating and identifying hard-to-find code defects.
Supports a Wide Range of Targets
The J-Trace PRO Cortex supports Cortex-A, Cortex-R, and Cortex-M targets, providing versatility for your development projects. Whether you're working on a complex application for high-performance Cortex-A processors or embedded systems with Cortex-M cores, this trace probe has covered you.
Full J-Link Debug Functionality
In addition to its trace capabilities, the J-Trace PRO Cortex retains full J-Link debug functionality. You can enjoy the benefits of a powerful debug probe alongside exceptional trace capabilities, making it a true all-in-one solution for your development needs.
Further Advantages - Unlock the Full Potential
Take your development process to the next level with J-Trace PRO Cortex's extended trace features:
Code Coverage Analysis
Gain visibility over which parts of your application code have been executed, enabling you to verify test completeness and identify untested areas.
Execution Profiling
Understand which instructions are executed and how often, allowing you to identify performance bottlenecks and optimization opportunities.
Take advantage of the opportunity to supercharge your development workflow. Get the J-Trace PRO Cortex now and revolutionize how you optimize and debug your projects!
Downloads
Questions and Answers
-
What Interfaces Does the J-Trace PRO Cortex Provide and Why Are They Advantageous?
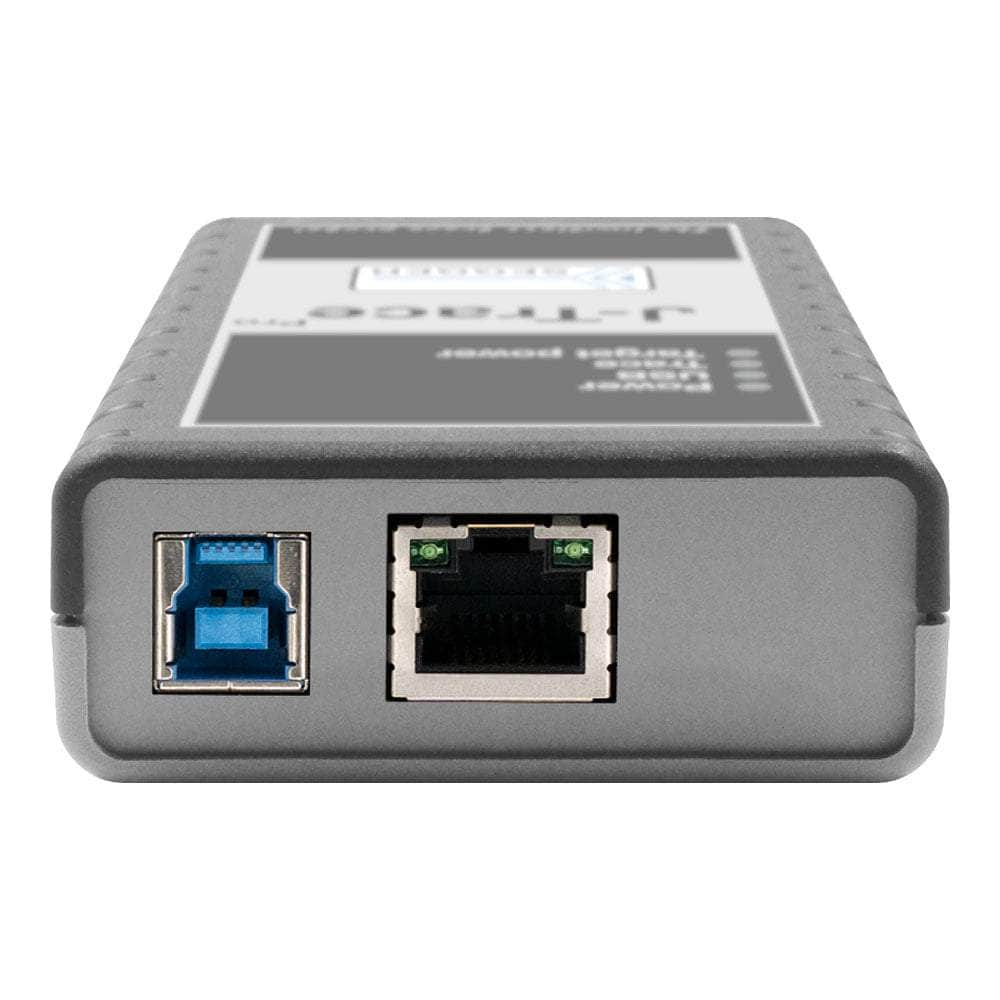
It has two interfaces: SuperSpeed USB 3.0 and Gigabit Ethernet.
- USB 3.0 gives continuous streaming trace at full system clock and download speeds up to 4MB/s, avoiding the bottleneck of USB 2.0.
- Gigabit Ethernet allows remote debugging over a network, for targets in test chambers, production environments or other locations.
Remote debugging is available over Ethernet as well as USB; streaming trace uses the USB 3.0 interface. There are also two target connectors: a 20-pin debug connector and a combined 19-pin debug and trace connector. Only one target connector can be used at a time.
-
How Does Unlimited Flash Breakpoints Work in the J-Trace PRO Cortex?
Unlimited Flash Breakpoints lets you set as many breakpoints as you need when debugging code that runs from flash memory.
The probe uses hardware breakpoints first (typically 4 to 6 on Cortex-M), then switches to software breakpoints in flash once those are used up. It uses instruction set simulation, flash caching and selective sector reprogramming to minimise flash write cycles. In practice you won't notice when you've passed the hardware breakpoint limit, and debugging in flash feels much like debugging in RAM.
It works with internal and external flash, including memory-mapped QSPI flash where hardware breakpoints cannot be used. This matters when the application has to run from flash because there isn't enough RAM.
-
What Software Tools Are Included with the J-Trace PRO Cortex?
It comes with SEGGER's professional software suite at no extra cost:
- Ozone, a graphical debugger and performance analyser with trace visualisation, code profiling, coverage analysis and instruction-level debugging. It needs no additional licences.
- J-Flash and J-Flash SPI for high-speed programming of internal and external flash.
- J-Link Software and Documentation Package for Windows, macOS and Linux, with regular free updates.
The software works with popular IDEs including Keil, IAR, Embedded Studio and Eclipse through standard debugging interfaces.
-
Which Cortex Architectures and Devices Does the J-Trace PRO Cortex Support?
It supports Cortex-A, Cortex-R and Cortex-M architectures:
- Cortex-M: M0, M0+, M1, M3, M4, M7, M23 and M33
- Cortex-A: A5, A7, A8, A9, A12, A15 and A17
- Cortex-R: R4 and R5
The tested devices list covers manufacturers such as STMicroelectronics, NXP, Infineon, Atmel, AmbiqMicro and many others. SEGGER adds device support through regular software updates to the J-Link software package.
-
What Are the Power and Connectivity Specifications for the J-Trace PRO Cortex?
The J-Trace PRO Cortex is USB-powered (maximum 400mA), so most configurations need no external power supply. Other specifications:
- Target interface voltage: 1.2V to 5V
- Maximum trace clock: 150MHz
- Data input rise/fall time: maximum 20ns
- Clock rise/fall time: maximum 10ns
- Dimensions: 123mm × 68mm × 30mm
- Weight: 120g without cables
- Operating temperature: +5°C to +60°C
- Storage temperature: -20°C to +65°C
- EMC standards: EN 55022, EN 55024
-
What Is the Segger J-Trace PRO Cortex Debugger and What Makes It Unique?
The SEGGER J-Trace PRO Cortex is a professional streaming trace probe for Cortex-A/R/M-based microcontrollers. What sets it apart:
- SuperSpeed USB 3.0 interface for continuous, unlimited streaming trace with full trace clock support, so you aren't limited by internal buffers or slow data transfer
- 64MB on-board trace buffer
- All J-Link debug functionality combined with trace analysis
- Download speeds up to 4MB/s
-
How Does the J-Trace PRO Cortex Compare to Higher-end Competitors Like Lauterbach TRACE32?
The J-Trace PRO Cortex can be running within 15 minutes using SEGGER's Ozone debugger. In our experience, TRACE32 has a longer learning curve. The J-Trace PRO Cortex offers:
- Windows, macOS and Linux support
- SuperSpeed USB 3.0 and Gigabit Ethernet interfaces
- Streaming trace at full system clock with real-time analysis
- Live code profiling and coverage analysis
-
Can the J-Trace PRO Cortex Capture Infrequent, Hard-to-Reproduce Bugs?
Yes. Its unlimited streaming trace can record complete traces over hours or even days, so you can catch intermittent faults that a buffer-limited debugger would miss.
When program flow "runs off the rails" and stops in a fault state, you get the trace data leading up to the failure. Continuous streaming via USB 3.0 runs at the full trace clock with no limit on the amount of trace data, and the 64MB on-board buffer adds extra margin. This helps with systems using communication stacks such as Ethernet or USB, where bugs may only appear under specific timing conditions or after long operation.
-
What Trace Analysis Features Does the J-Trace PRO Cortex Provide for Code Optimisation?
It provides Live Code Profiling and Live Code Coverage, shown in the Ozone debugger.
- Live Code Profiling shows in real time which instructions execute and how often, so you can find performance hotspots.
- Live Code Coverage shows at instruction level which parts of the code have run, which helps with regulatory requirements and thorough testing.
- Ozone displays execution counters live alongside the source code as the application runs.
- Instruction-level trace lets you verify code paths, analyse function call durations and measure CPU load per function.
All trace data can be exported for further analysis or compliance documentation, for example on safety-critical projects.
-
Does the J-Trace PRO Cortex Support Multi-Core Debugging?
Yes. Multiple debuggers or debugger instances can use the same J-Trace PRO at the same time, so you can debug different cores on a multi-core target in parallel.
You only need to set up the scan chain correctly for each debugger instance. No special multi-core settings are needed. This suits multi-core Cortex-A and Cortex-R processors. Whether trace is available, and on which cores, depends on the device's trace implementation.
No questions match your search.