
SEGGER Microcontroller GmbH
SEGGER J-Trace PRO Trace Probe
SEGGER J-Trace PRO Trace Probe
SKU: 8.24.00
Zahlungsmethoden
- Banküberweisung
Verfügbarkeit für Abholungen konnte nicht geladen werden
Key Features
Overview
The J-Trace PRO is SEGGER's all-in-one streaming trace probe, covering ARM Cortex-A, Cortex-R and Cortex-M trace plus RISC-V N-Trace in one unit. It streams trace over USB 3.0 SuperSpeed or Gigabit Ethernet, has a 64 MB on-board trace buffer and downloads at up to 4.0 MB/s. It works with 1.2V to 5V target interfaces.
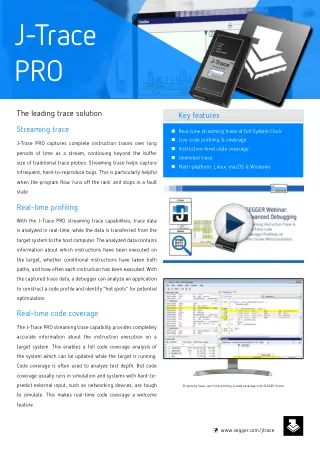
The SEGGER J-Trace PRO (part number 8.24.00) is SEGGER's all-in-one streaming trace probe, covering ARM Cortex-A, Cortex-R and Cortex-M trace plus RISC-V N-Trace in one unit. It streams trace to the host over USB 3.0 SuperSpeed or Gigabit Ethernet, has a 64 MB on-board trace buffer, downloads at up to 4.0 MB/s and works with 1.2V to 5V target interfaces. It suits firmware teams that trace both ARM and RISC-V targets and want one probe on the bench for both.
Streaming Trace Probe for ARM Cortex and RISC-V
Streaming trace sends data continuously to the PC instead of stopping when a buffer fills, so a recording can run long enough to catch a rare fault or a program that ends up stuck in a fault handler. SEGGER's Knowledge Base lists ETM and PTM trace for ARM Cortex, ETB trace, and N-Trace BTM for RISC-V on current J-Trace PRO hardware. Trace data feeds live code coverage and profiling while the target runs.
Debug and Trace Connectors
The probe has two target connectors: the 20-pin JTAG/SWD connector used across the J-Link range, with a 14-pin adapter available, and a 19-pin 0.05" JTAG/SWD and Trace connector that carries the trace clock and four trace data lines. Targets with a 38-pin Mictor header connect through the J-Trace Mictor 38 Adapter. Pin assignments for the 20-pin connector are in our SEGGER J-Link 20-pin connector pinout guide. Supported debug interfaces are JTAG, cJTAG, SWD, SWD multi-drop and SWO, and the probe can supply 5V to the target.
Full J-Link PRO Debug Capability
J-Trace PRO is also a complete J-Link. It includes the full set of J-Link PRO licences, including Unlimited Flash Breakpoints, and supports Real Time Transfer (RTT) and monitor-mode debugging on ARMv7-M and ARMv8-M. SEGGER allows Ozone, its debugger and trace analysis tool, to be used free of charge with a J-Trace PRO, including for commercial use. Ozone is SEGGER's recommended tool for trace analysis; debugging works from any J-Link compatible IDE. Software runs on Windows, Linux and macOS, including ARM64 and Apple Silicon hosts.
Beyond ARM and RISC-V, SEGGER's core list for J-Trace PRO includes debug support for Cadence Tensilica HiFi, Fusion F1 and Xtensa LX6/LX7, Microchip PIC32MX, PIC32MZ and PIC32WK, Renesas RX and RH850, ARM China STAR-MC, and Silicon Labs EFM8.
What's Included
- J-Trace PRO probe
- Cortex-M Trace Reference Board, with an example project that runs out of the box
- 20-pin 0.05" target ribbon cable
- 20-pin 0.1" target ribbon cable
- Micro USB cable
- USB 3.0 cable
Specifications
| Host interface | USB 3.0 SuperSpeed; Gigabit Ethernet |
|---|---|
| Target interface | JTAG/SWD 20-pin (14-pin adapter available); JTAG/SWD + Trace 19-pin 0.05" (38-pin Mictor adapter available) |
| Trace | Streaming trace; ETM, PTM and ETB (ARM Cortex); N-Trace BTM (RISC-V) |
| On-board trace buffer | 64 MB |
| Target interface voltage (VIF) | 1.2V to 5V |
| Target interface speed | Max. 50 MHz |
| Download speed | Up to 4.0 MB/s |
| Power supply | USB powered, max. 400mA |
| Reset type | Open drain with 100 Ohm series resistor, can be pulled low or tristated |
| Trace capacitive load | 3 pF J-Trace plus 8 pF cable (typical) |
| Dimensions (without cables) | 123mm x 68mm x 30mm |
| Weight (without cables) | 120g |
| Operating temperature | +5°C to +60°C |
| Storage temperature | -20°C to +65°C |
| Relative humidity | Max. 90% rH, non-condensing |
| EMC | EN 55022, EN 55024 |
| Host OS | Windows and Linux (x86-64, ARM64); macOS (x86-64, Apple Silicon) |
Limitations
- Trace needs the target to implement trace hardware and bring the trace pins out to a connector; SEGGER notes that trace setup depends on the target hardware design.
- No VCOM and no CMSIS-DAP v1 (HID) mode.
- Most IDEs offer little or no trace analysis; plan on Ozone for coverage and profiling.
- The Mictor 38 adapter is a separate purchase.
J-Trace PRO Compared with the Other J-Trace PRO Models
| Model | Trace architectures | Cortex-M Trace Reference Board in box | Price ex VAT |
|---|---|---|---|
| J-Trace PRO (this product) | ARM Cortex-A, Cortex-R, Cortex-M and RISC-V | Yes | €3.759,95 |
| J-Trace PRO Cortex | ARM Cortex-A, Cortex-R and Cortex-M | Yes | €2.508,95 |
| J-Trace PRO Cortex-M | ARM Cortex-M | Yes | €1.895,95 |
| J-Trace PRO RISC-V | RISC-V (RV32, RV64) | Not listed | €2.508,95 |
Typical Applications
Instruction trace on a Cortex-M7 or Cortex-M33 board to find an intermittent hard fault after hours of running. Live code coverage on a RISC-V core from SiFive, Andes or Nuclei to show which code paths a test suite exercised. Trace on a Cortex-A53 or Cortex-R52 subsystem from the same probe used for the Cortex-M side of the project.
Choose the J-Trace PRO when your work spans ARM and RISC-V targets; if you only trace one architecture, compare the architecture-specific models in the table.
Order the J-Trace PRO for €3.759,95 ex VAT. Check your device's trace pins, or ask us for a formal quotation. See the full range in our SEGGER debug probes collection.
Last reviewed 16/11/2026.
| General | |
|---|---|
| Reset type | Open drain with 100 Ohm series resistor, can be pulled low or tristated |
| Host and Target Interface | |
| Host interface | USB 3.0 SuperSpeed; Gigabit Ethernet |
| Target interface | JTAG/SWD 20-pin (14-pin adapter available); JTAG/SWD + Trace 19-pin 0.05" (38-pin Mictor adapter available) |
| Target interface voltage (VIF) | 1.2V to 5V |
| Performance | |
| Trace | Streaming trace; ETM, PTM and ETB (ARM Cortex); N-Trace BTM (RISC-V) |
| On-board trace buffer | 64 MB |
| Target interface speed | Max. 50 MHz |
| Download speed | Up to 4.0 MB/s |
| Trace capacitive load | 3 pF J-Trace plus 8 pF cable (typical) |
| Power | |
| Power supply | USB powered, max. 400mA |
| Software and Compatibility | |
| Host OS | Windows and Linux (x86-64, ARM64); macOS (x86-64, Apple Silicon) |
| Physical | |
| Dimensions (without cables) | 123mm x 68mm x 30mm |
| Weight (without cables) | 120g |
| Environmental | |
| Operating temperature | +5°C to +60°C |
| Storage temperature | -20°C to +65°C |
| Relative humidity | Max. 90% rH, non-condensing |
| EMC | EN 55022, EN 55024 |
| Ordering information | |
| Part number (SKU) | 8.24.00 |
| Manufacturer | SEGGER Microcontroller GmbH |
| EAN | 5055383613939 |
| Warranty | 12 months |
| Shipping weight | 1.0 kg |
- 1 ×J-Trace PRO trace probe
- 1 ×Cortex-M Reference Board
- 1 ×20-pin, 0.05" target ribbon cable
- 1 ×20-pin, 0.1" target ribbon cable
- 1 ×Micro USB cable
- 1 ×USB 3.0 cable
SEGGER J-Trace PRO Trace Probe compared with SEGGER J-Trace PRO Cortex Trace Debugger , SEGGER J-Trace PRO Cortex-M Trace-Debugger and SEGGER J-Trace PRO RISC-V Debug Probe on 15 specifications.
| Specification | This product SEGGER J-Trace PRO Trace Probe8.24.00Available to order |
 SEGGER J-Trace PRO Cortex Trace Debugger8.20.00Available to order |
 SEGGER J-Trace PRO Cortex-M Trace-Debugger8.18.00In stock |
 SEGGER J-Trace PRO RISC-V Debug Probe8.22.00Available to order |
|---|---|---|---|---|
| Debug architectures | ARM Cortex-A/R/M, legacy ARM, ARM China STAR-MC, RISC-V, Cadence Tensilica, Microchip PIC32, Renesas RX and RH850, Silicon Labs EFM8 | ARM Cortex-A, Cortex-R and Cortex-M | ARM Cortex-M (incl. SC000, SC300) | RISC-V (RV32, RV64) |
| ARM Cortex trace | ETM, PTM, ETB | ETM, PTM, ETB | ETM, ETB (Cortex-M only) | Not supported |
| RISC-V trace | N-Trace BTM | Not supported | Not supported | N-Trace BTM |
| Trace pins | 4-bit (TRACECLK, TRACEDATA[0..3]) on 19-pin 0.05" connector | 4-bit (TRACECLK, TRACEDATA[0..3]) on 19-pin 0.05" connector | 4-bit (TRACECLK, TRACEDATA[0..3]) on 19-pin 0.05" connector | 4-bit (TRACECLK, TRACEDATA[0..3]) on 19-pin 0.05" connector |
| Streaming trace | Supported | Supported | Supported | Supported |
| On-board trace buffer | 64 MB | 64 MB | 64 MB | 64 MB |
| Host interface | USB 3.0 SuperSpeed and Gigabit Ethernet | USB 3.0 SuperSpeed and Gigabit Ethernet | USB 3.0 SuperSpeed and Gigabit Ethernet | USB 3.0 SuperSpeed and Gigabit Ethernet |
| Target interface speed | Max. 50 MHz | Max. 50 MHz | Max. 50 MHz | Max. 50 MHz |
| Download speed | Up to 4 MB/s | Up to 4 MB/s | Up to 4 MB/s | Up to 4 MB/s |
| Target interface voltage (VIF) | 1.2 V to 5 V | 1.2 V to 5 V | 1.2 V to 5 V | 1.2 V to 5 V |
| SWO | Supported | Supported | Supported | Not supported |
| ARM monitor mode debugging | ARMv7-M and ARMv8-M | ARMv7-M and ARMv8-M | ARMv7-M and ARMv8-M | Not supported |
| 5 V target supply | Supported | Supported | Supported | Supported |
| Trace reference board in the box | Cortex-M Trace Reference Board | Cortex-M Trace Reference Board | Cortex-M Trace Reference Board | Not included |
| Software licences | Full set of J-Link PRO licences (incl. Unlimited Flash Breakpoints); Ozone included | Full set of J-Link PRO licences (incl. Unlimited Flash Breakpoints); Ozone included | Full set of J-Link PRO licences (incl. Unlimited Flash Breakpoints); Ozone included | Full set of J-Link PRO licences (incl. Unlimited Flash Breakpoints); Ozone included |
| Price | €3.759,95 | €2.508,95 | €1.895,95 | €2.508,95 |

 SEGGER AN00016 Analyzing HardFaults on Cortex-M CPUsSEGGER application note on finding the cause of HardFaults on Cortex-M devices using a HardFault handler and a debugger to...
 SEGGER AN08005 Using RTT on Cortex-A/R Based DevicesSEGGER application note on using Real Time Transfer (RTT) with J-Link on Cortex-A and Cortex-R devices.
 SEGGER AN00021 Connecting J-Link to STM32 Discovery BoardsSEGGER application note on connecting a J-Link to STM32 Discovery evaluation boards in place of the on-board ST-LINK.
Questions and Answers
-
Can the J-Trace PRO Be Used as a Normal J-Link Debug Probe?
Yes. It has all J-Link debug probe capabilities and the full set of J-Link PRO licences, including Unlimited Flash Breakpoints, and works with J-Link software and J-Link compatible IDEs.
-
What Does the Target Need for Trace?
The device must implement trace hardware (ETM or PTM on ARM, N-Trace on RISC-V) and the trace clock and data pins must be wired to the 19-pin 0.05" connector or a Mictor header. SEGGER publishes a list of tested devices with ready-made example projects.
-
Is the Ethernet Connection Isolated?
The Ethernet data lines are isolated to IEEE 802.3, 1500 Vrms for one minute. The shield is not, so use an unshielded twisted pair cable when you rely on that isolation.
-
What Are the Connectivity Advantages of Dual USB 3.0 and Ethernet Interfaces?
SuperSpeed USB 3.0 gives download speeds up to 4MB/s for fast development cycles. Gigabit Ethernet allows remote debugging over networks and integration into test farms, which helps with systems in inaccessible locations or automated test setups.
-
Can the J-Trace PRO Debug Multiple Processor Cores Simultaneously?
Yes. Multiple debugger instances can share the same physical connection, with each core accessed through the JTAG scan chain configuration. This lets you debug different cores on the same target at the same time, including multi-core and heterogeneous processing architectures.
-
What Trace Memory Capacity Does the J-Trace PRO Provide, and Why Is This Significant?
The J-Trace PRO has a 64MB on-board trace buffer plus unlimited streaming. Streaming allows continuous capture over unlimited periods, so it suits both short debugging sessions and long-term system analysis.
-
How Does the Ozone Debugger Enhance the J-Trace PRO's Capabilities?
Ozone is SEGGER's debugger for visualising J-Trace PRO trace data. It provides:
- Timeline views, execution counters and code coverage displays
- Real-time trace analysis with live updating counters
- Function profiling and instruction tracing
- Performance analysis
- Automated report generation for verification
-
What Makes the J-Trace PRO Different From Standard Debugging Probes?
The J-Trace PRO combines all J-Link debugging capabilities with streaming trace in one unit. Conventional probes capture limited trace data to internal buffers, whereas the J-Trace PRO provides unlimited streaming trace with real-time analysis, giving visibility over long runs up to the fault. This makes it effective for capturing intermittent bugs that occur infrequently over long periods.
-
Which Processor Architectures Does the J-Trace PRO Support?
The J-Trace PRO supports ARM Cortex-M, Cortex-A, Cortex-R and RISC-V processors. Debug Store also stocks variants optimised for specific architectures.
-
How Does Unlimited Streaming Trace Benefit Embedded Developers?
Unlimited streaming trace captures complete instruction traces with no internal buffer limit on recording time. You can record hard-to-reproduce bugs that appear over hours or days and see exactly what happened when a program "runs off the rails". Streaming runs at the full trace clock, up to 150 MHz (TPIU frequency up to 300 MHz).
-
What Is Live Code Profiling and How Does It Improve Development Efficiency?
Live Code Profiling shows in real time which instructions have executed and how often, so you can find performance hotspots and optimisation opportunities while the system runs. It's non-intrusive, using ARM's Embedded Trace Macrocell (ETM) without code instrumentation, so it suits hard real-time systems where you can't modify the code.
-
How Does the J-Trace PRO's Code Coverage Functionality Assist with Regulatory Compliance?
The J-Trace PRO provides instruction-level code coverage that is non-intrusive and doesn't alter code execution. This gives verifiable evidence of which code sections ran during testing, which helps meet regulatory requirements. Coverage reports can be exported for documentation and certification, for example on safety-critical applications.

No questions match your search.
