

SEGGER Microcontroller GmbH
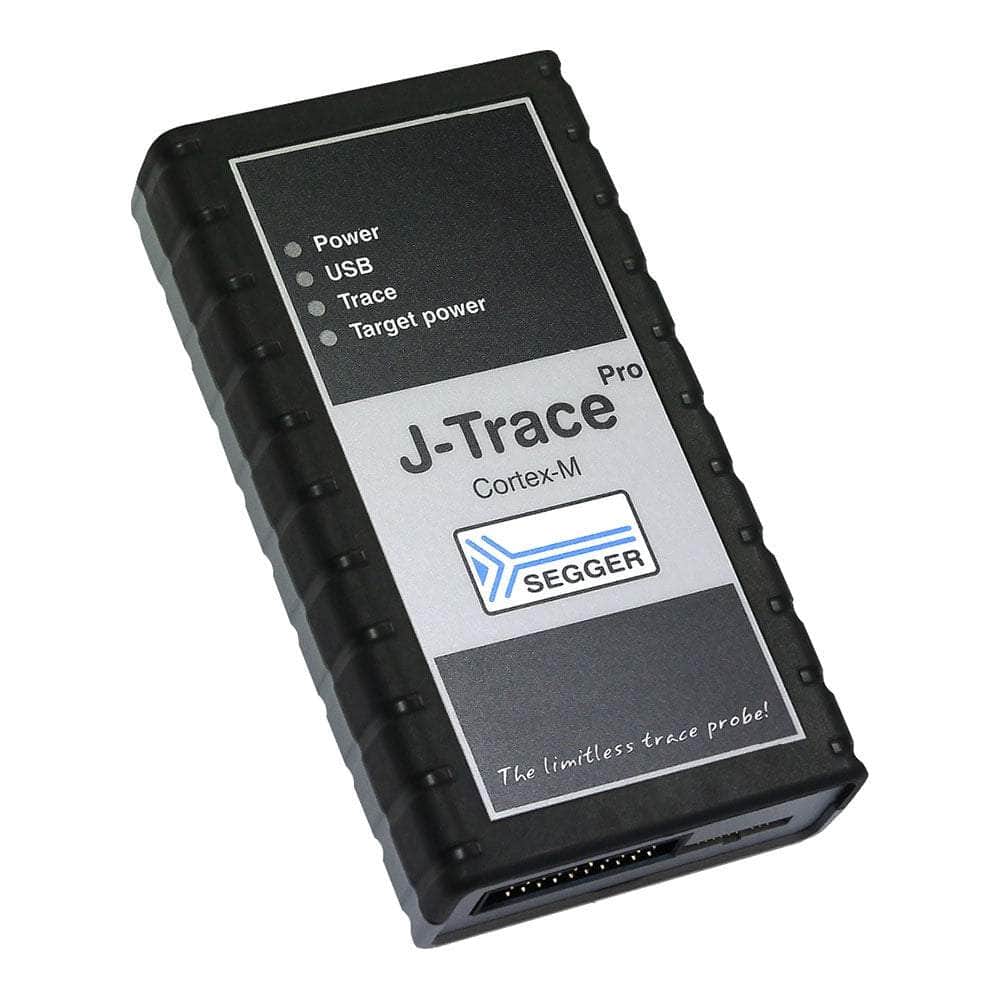
SEGGER J-Trace PRO Cortex-M Trace-Debugger
SEGGER J-Trace PRO Cortex-M Trace-Debugger
SKU: 8.18.00
Verfügbarkeit für Abholungen konnte nicht geladen werden


Key Features
Overview
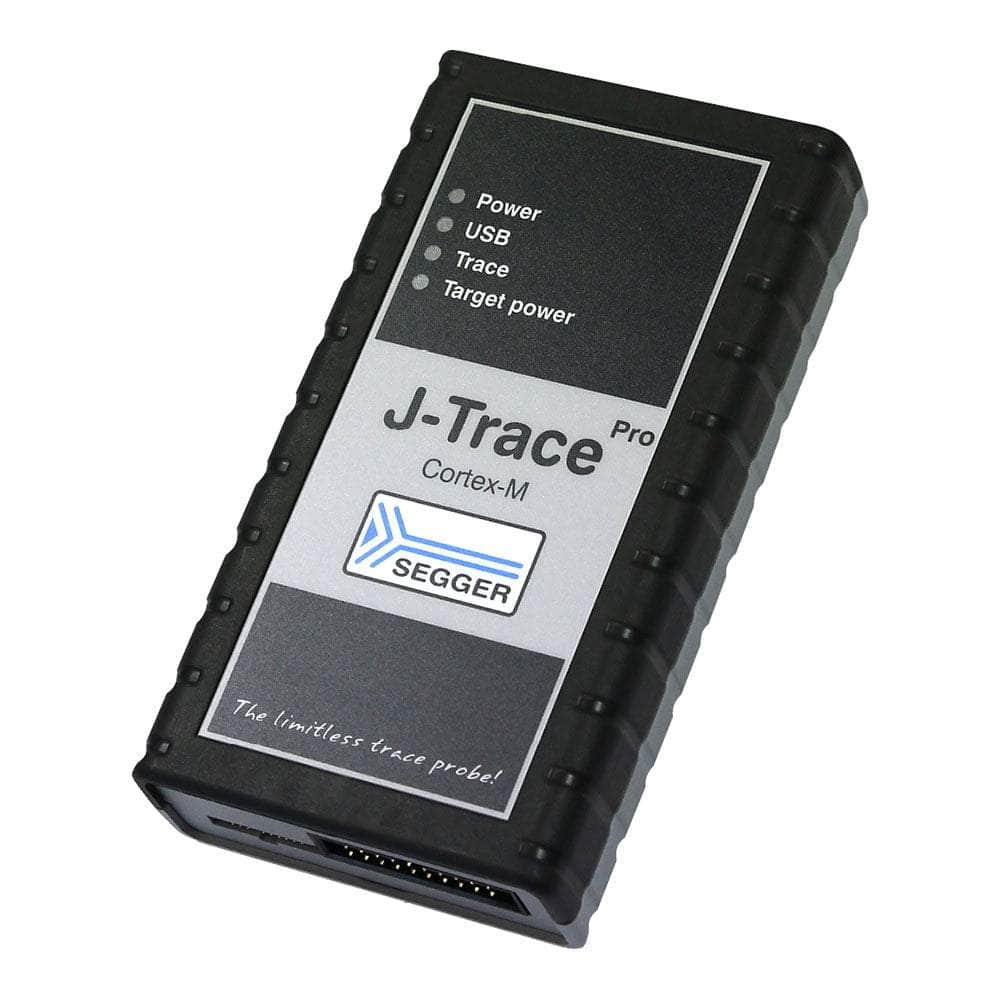
The J-Trace PRO Cortex-M is SEGGER's specialised streaming trace probe designed specifically for ARM Cortex-M microcontrollers. Unlike traditional trace solutions limited by internal buffer sizes, this probe enables unlimited real-time instruction tracing through SuperSpeed USB 3.0 and Gigabit Ethernet interfaces.
Where It Fits
- Cortex-M Specific J-Trace PRO Cortex (Multi-Core)
- All Architectures J-Trace PRO Universal
Why It Matters
| Feature | Why It's Important | What You Gain |
|---|---|---|
| Streaming Trace | No buffer limitations | Capture months of trace data continuously |
| Live Analysis | Real-time insights | Debug whilst target runs at full speed |
| ETM Support | Complete instruction visibility | See every executed instruction with timing |
Wiring Quick-Start
| Host | Direction | Through | Device | Notes |
|---|---|---|---|---|
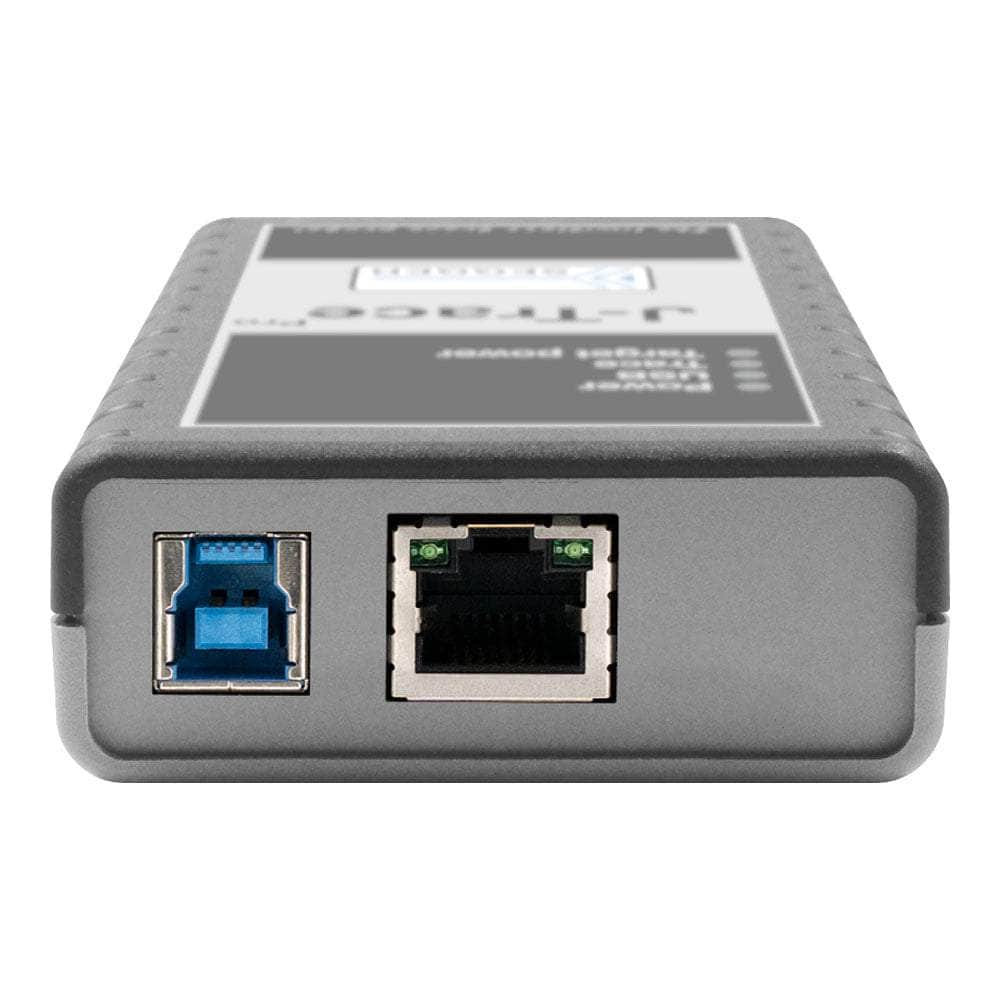
| USB 3.0 Port | → | USB Cable | J-Trace USB Port | SuperSpeed for streaming |
| Ethernet Port | → | Cat5/6 Cable | J-Trace LAN Port | Alternative connection |
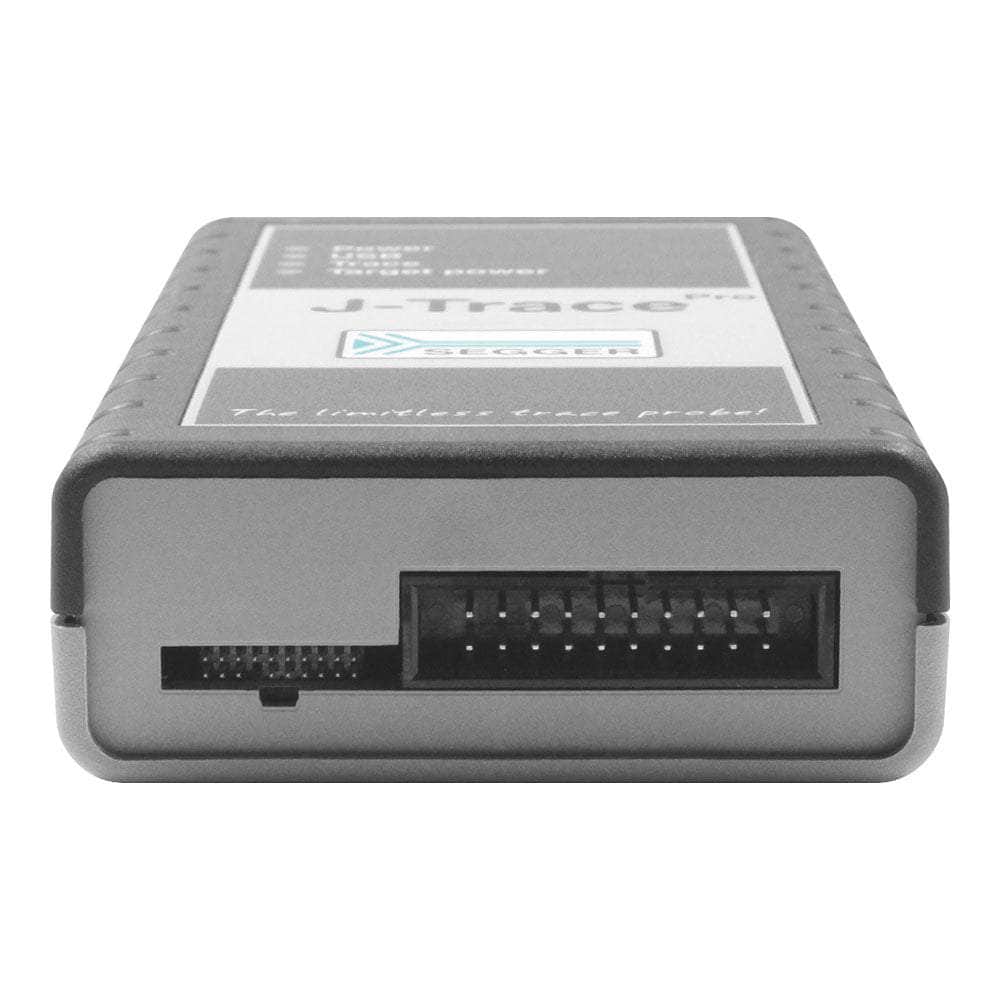
| J-Trace Target | → | 20-pin Ribbon | MCU Debug Header | JTAG/SWD signals |
| J-Trace Trace | → | 0.05" Connector | MCU Trace Pins | ETM trace data |
Code Snippet
// Cortex-M4 ETM trace setup example #define ETM_BASE 0xE0041000 #define TPIU_BASE 0xE0040000
void setup_trace(void) {
// Enable trace clock
CoreDebug->DEMCR |= CoreDebug_DEMCR_TRCENA_Msk;

Data format:

text
// Configure ETM for instruction trace
ETM->CR = 0x00000D1E;  // Enable ETM
ETM->TRIGGER = 0x406F; // Trigger events

// Setup TPIU for external trace
TPIU->SPPR = 0x00000002; // NRZ protocol
TPIU->ACPR = 0x0000000F; // Trace clock prescaler
}
Downloads
Einführung von SEGGER J-Trace PRO: Die ultimative Streaming Trace Probe
Sind Sie ein Embedded-Entwickler auf der Suche nach der perfekten Debugging-Lösung? Dann sind Sie hier richtig! SEGGER J-Trace erfüllt mit seinen unübertroffenen Funktionen und dem nahtlosen Trace-Erlebnis alle Ihre Debugging-Anforderungen.
Entfesseln Sie die Leistung von Unlimited Streaming Trace
Mit SEGGER J-Trace haben Sie unbegrenzten Zugriff auf Streaming-Trace und können vollständige Traces über lange Zeiträume hinweg erfassen. So entgehen Sie nie wieder den schwer zu findenden Bugs, die aus dem Nichts auftauchen! Zeichnen Sie seltene, schwer reproduzierbare Bugs auf und analysieren Sie sie mühelos, selbst wenn Ihr Programmfluss entgleist und in einem Fehlerzustand stoppt.
Live-Codeabdeckung und Profilerstellung immer zur Hand
J-Trace PRO unterstützt erweiterte Funktionen wie Live Code Coverage und Live Code Profiling, die über herkömmliche Trace-Sonden hinausgehen. Behalten Sie mit Live Code Coverage im Auge, welche Teile Ihres Anwendungscodes ausgeführt wurden, und gewinnen Sie mit Live Code Profiling wertvolle Einblicke in die Ausführungshäufigkeit von Anweisungen. Identifizieren Sie Hotspots in Ihrem Code, um Optimierungsmöglichkeiten zu finden, und optimieren Sie Ihren Entwicklungsprozess.
Unterstützung für Cortex-M-basierte Mikrocontroller
Die J-Trace PRO Cortex-M-Variante bietet nahtlose Unterstützung für Cortex-M-basierte Mikrocontroller. Die SuperSpeed USB 3.0-Schnittstelle ermöglicht kontinuierliches Streaming-Trace über USB mit dem vollen Trace-Takt. Diese Echtzeit-Streaming-Funktion stellt sicher, dass Sie Daten über längere Zeiträume ohne Einschränkungen erfassen können und liefert Ihnen alle Einblicke, die Sie benötigen, um Ihren Code effektiv zu entwickeln und zu optimieren.
Profitieren Sie vom ultimativen Debugging-Erlebnis! Nutzen Sie SEGGER J-Trace noch heute und bringen Sie Ihren Embedded-Entwicklungsprozess auf ein neues Niveau!
| General Information | |
|---|---|
Part Number (SKU) |
8.18.00
|
Manufacturer |
|
| Physical and Mechanical | |
Weight |
0.5 kg
|
| Other | |
EAN |
5055383615353
|
Frequently Asked Questions
Have a Question?
-
What's included in the box with the J-Trace PRO Cortex-M?
The package includes the J-Trace PRO hardware, USB 3.0 cable, Ethernet cable, 20-pin 0.1" JTAG/SWD ribbon cable, 20-pin 0.05" trace cable, and software licenses for Ozone debugger and J-Flash programmer.
-
Is the J-Trace PRO Cortex-M compatible with multi-core systems?
This model focuses on single Cortex-M core tracing. For multi-core ARM systems or mixed architectures, consider the <a href="">J-Trace PRO Universal.
-
What trace analysis features does the included Ozone debugger provide?
Ozone offers live code profiling (execution timing and hotspot analysis), live code coverage (instruction-level coverage tracking), and historical trace browsing with source code correlation.
-
Can I debug remotely over Ethernet?
Yes, the integrated Gigabit Ethernet interface enables remote debugging across networks. This is particularly useful for accessing targets in test environments or when the development PC cannot be physically connected.
-
How fast is the flash programming compared to standard J-Link?
The J-Trace PRO achieves up to 4MB/s download speeds, significantly faster than standard debug probes. This reduces development iteration time when loading large applications or frequent code updates.
-
Do I need special target hardware modifications for trace?
Your target must expose the ETM trace pins (typically TRACECLK and TRACEDATA[3:0]) on a connector. Many development boards include these signals on debug headers. No target code modifications are required.
-
What's the difference between this and the regular J-Trace PRO?
The Cortex-M model is optimised specifically for Cortex-M cores and costs less than the universal J-Trace PRO. The universal model additionally supports Cortex-A, Cortex-R, and RISC-V architectures.
-
Can I use the J-Trace PRO Cortex-M with my existing IDE?
Yes, it integrates with all major development environments including IAR Embedded Workbench, Keil µVision, Eclipse-based IDEs, and GCC toolchains. The included Ozone debugger works independently of any IDE.
-
How does streaming trace differ from traditional trace buffers?
Traditional trace probes capture limited data in internal buffers (typically 4-32MB). Streaming trace continuously transfers data to the host PC via USB 3.0 or Ethernet, enabling unlimited capture periods without data loss.
-
What ARM Cortex-M cores does the J-Trace PRO Cortex-M support?
The probe supports all ARM Cortex-M variants including M0, M0+, M1, M3, M4, M7, M23, M33, M52, M55, and M85 cores. It works with any Cortex-M microcontroller that provides ETM trace output pins.