
SEGGER Microcontroller GmbH
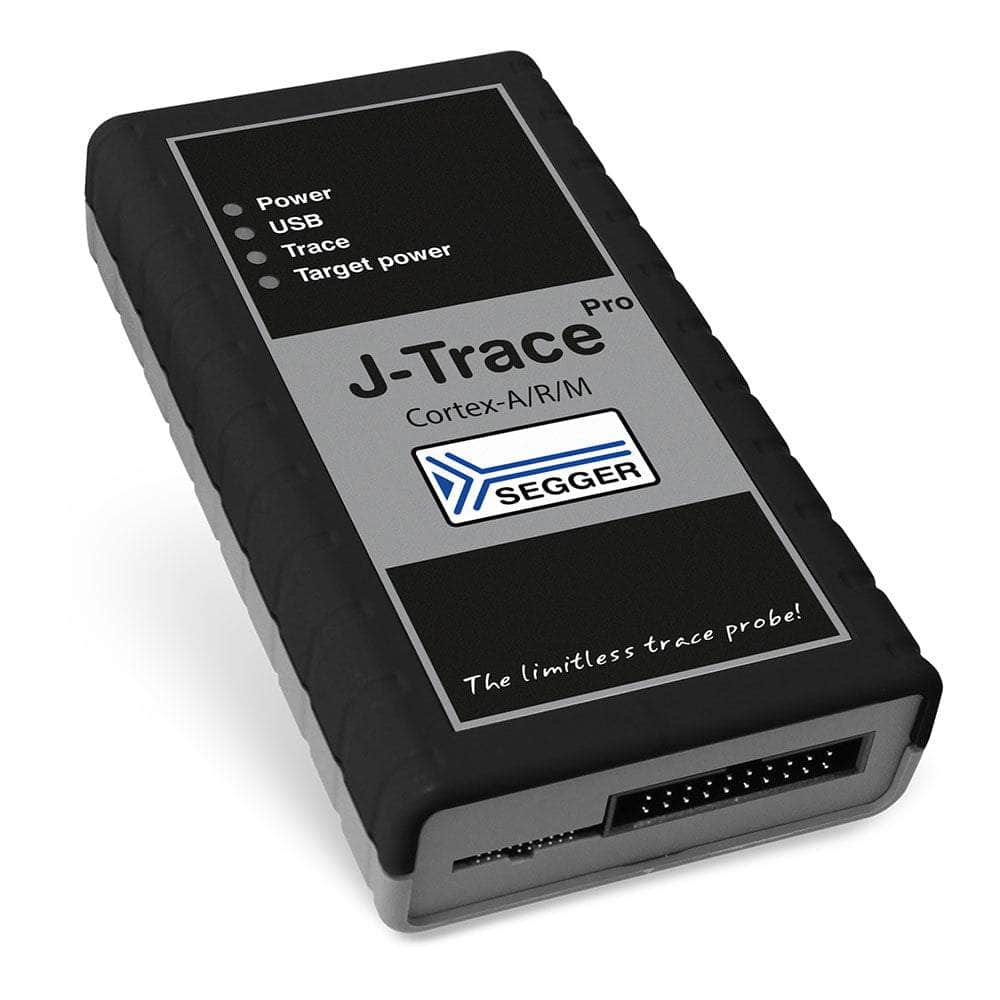
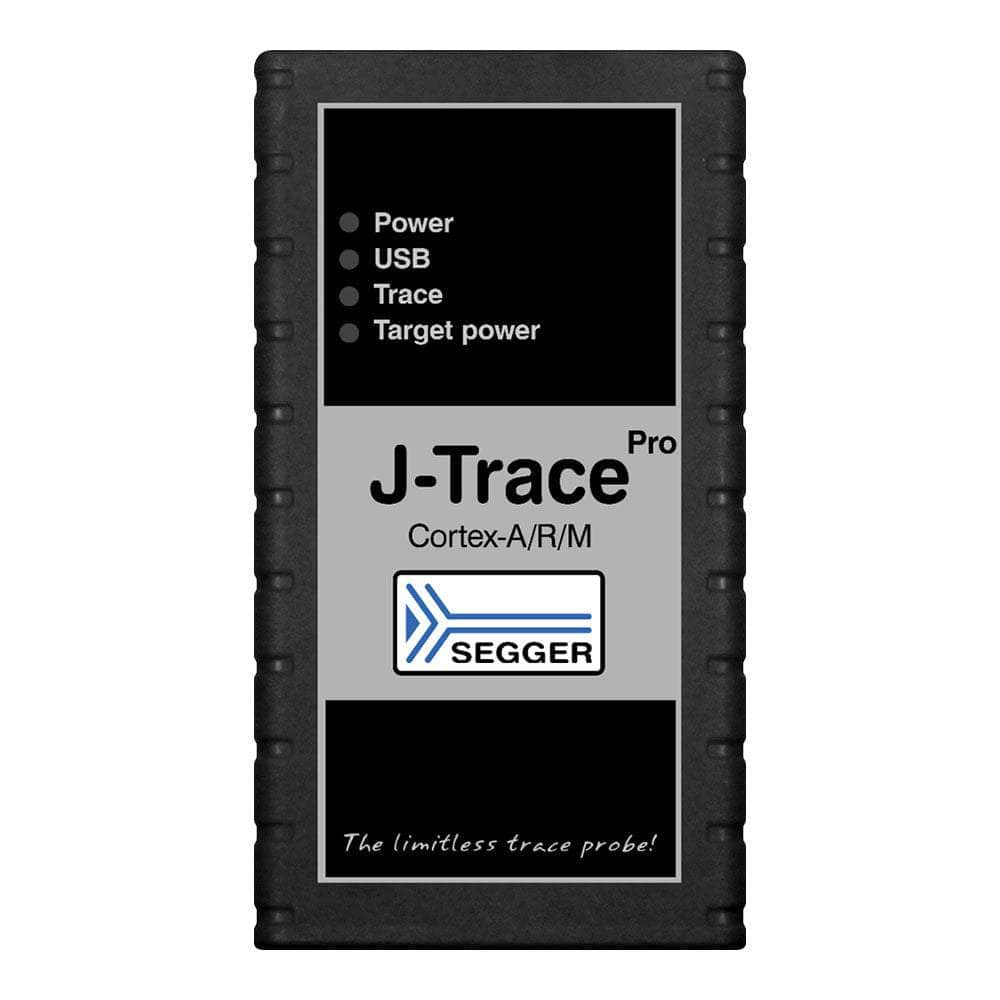
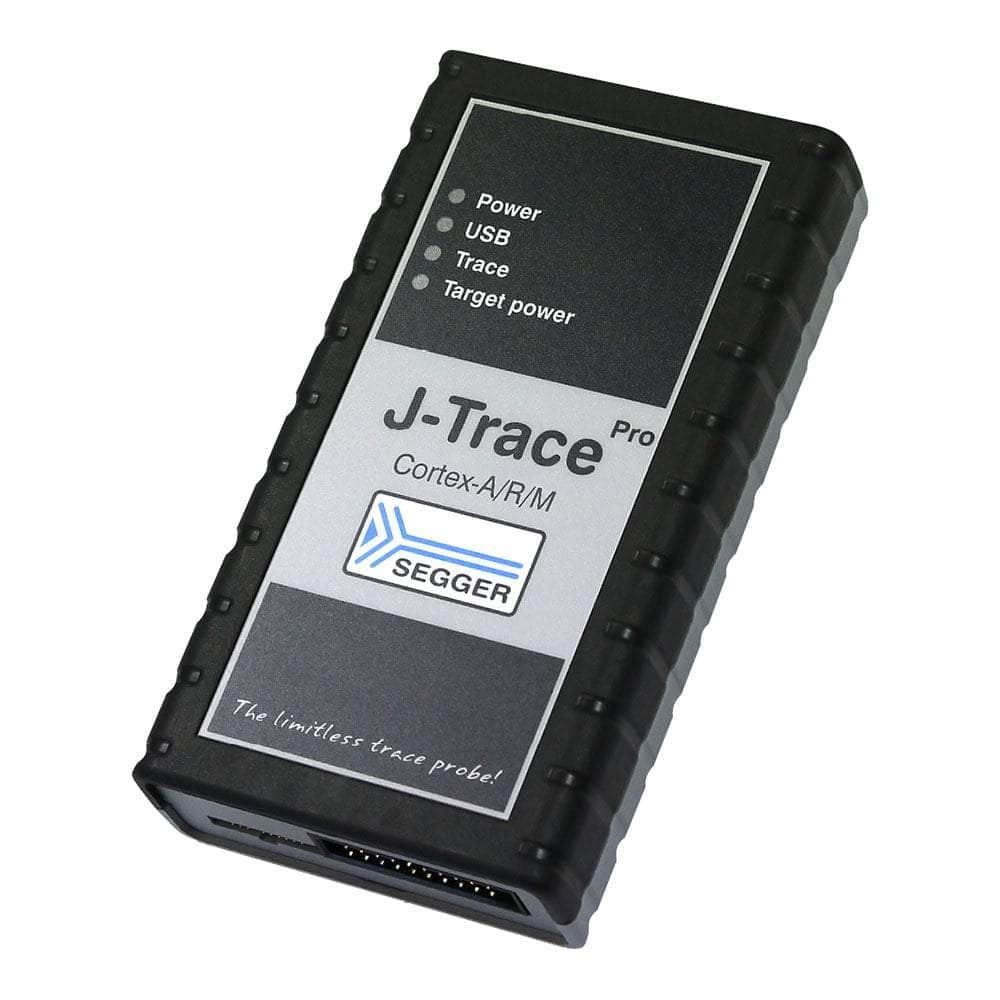
Débogueur de traces Cortex SEGGER J-Trace PRO
Débogueur de traces Cortex SEGGER J-Trace PRO
SKU: 8.20.00
Moyens de paiement
- Bank transfer
Impossible de charger la disponibilité du service de retrait
Caractéristiques principales
Overview
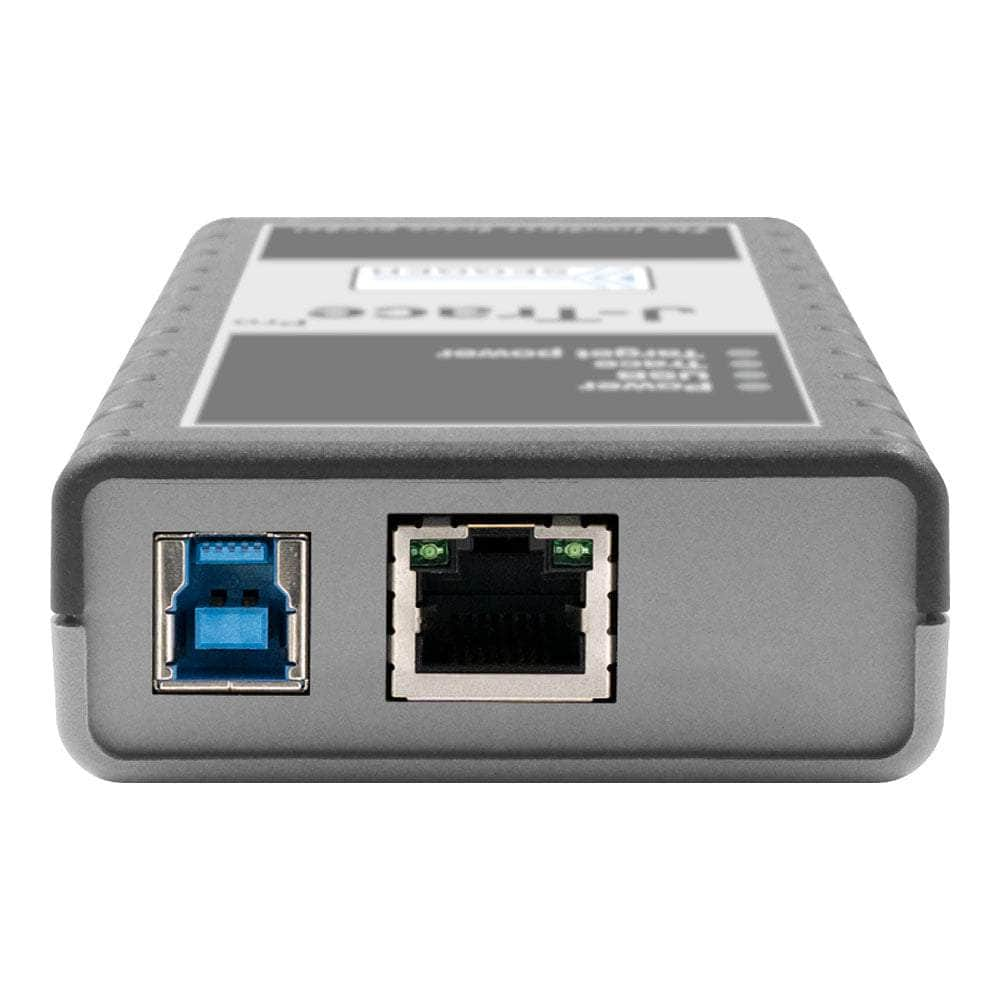
The J-Trace PRO Cortex is a streaming trace probe for ARM Cortex-A, Cortex-R and Cortex-M devices, with ETM and PTM trace. It connects over USB 3.0 SuperSpeed or Gigabit Ethernet, downloads at up to 4.0 MB/s and has a 1.2V to 5V target interface. It combines J-Link debugging with unlimited instruction trace, live code coverage and live code profiling.
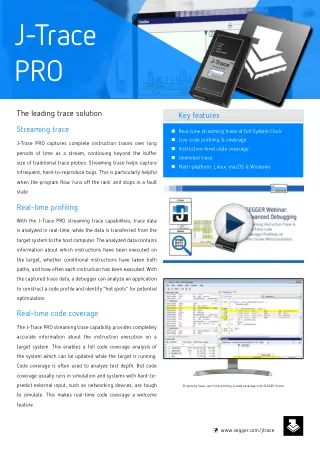
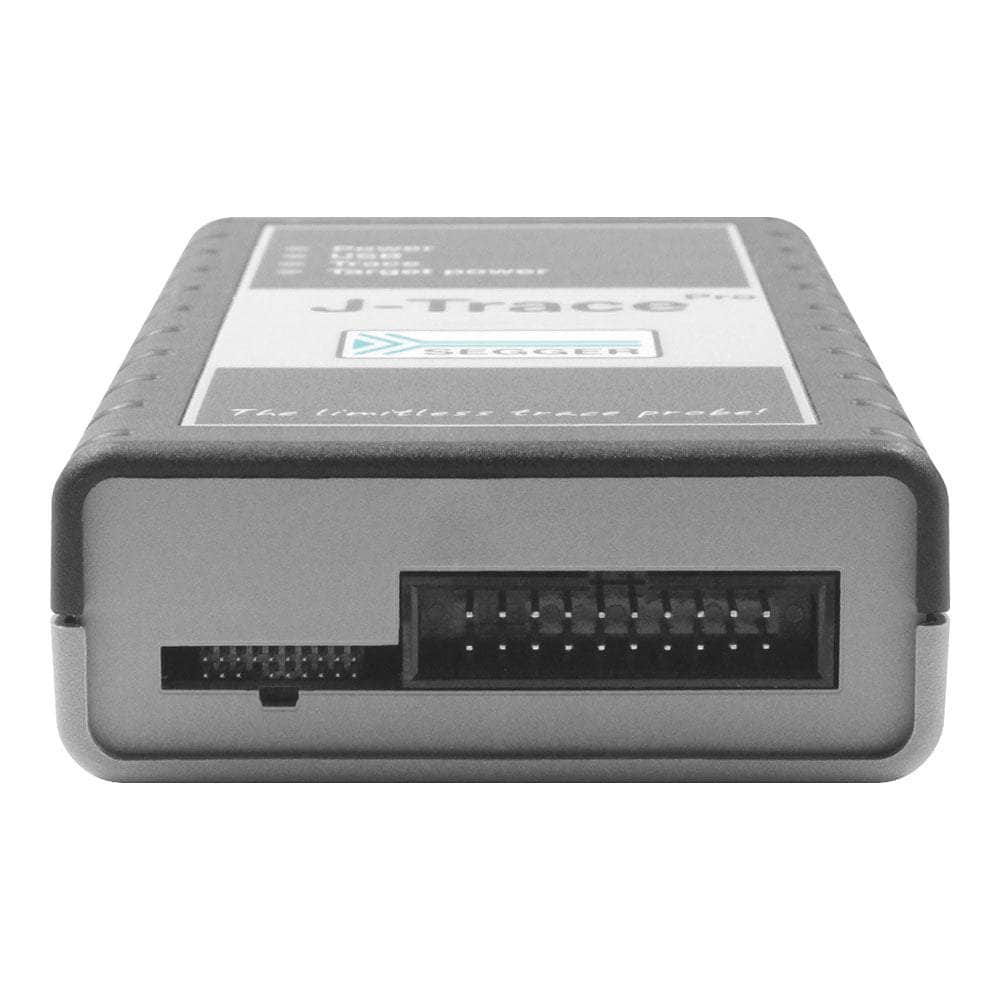
The SEGGER J-Trace PRO Cortex (part number 8.20.00) is a streaming trace probe for ARM Cortex-A, Cortex-R and Cortex-M devices, with ETM and PTM trace, a USB 3.0 SuperSpeed and Gigabit Ethernet host link, download speeds up to 4.0 MB/s and a 1.2V to 5V target interface. It combines J-Link debugging with unlimited instruction trace, live code coverage and live code profiling. It suits firmware teams working across Cortex-A, Cortex-R and Cortex-M targets.
Streaming Trace for Cortex-A, Cortex-R and Cortex-M
Streaming trace sends data continuously to the PC instead of stopping when a buffer fills, so a recording can run long enough to catch a rare fault or a program that ends up stuck in a fault handler. SEGGER's Knowledge Base lists ETM, PTM and ETB trace for ARM Cortex on this model. The supported cores list covers Cortex-A5 to Cortex-A17, Cortex-A53, A55, A57, A72 and A76, Cortex-R4, R5, R8, R52 and R82, Cortex-M0 to Cortex-M85, and SC000 and SC300. RISC-V is not supported; use the J-Trace PRO or J-Trace PRO RISC-V for those targets.
Debug and Trace Connectors
The probe has two target connectors: the 20-pin JTAG/SWD connector used across the J-Link range, with a 14-pin adapter available, and a 19-pin 0.05" JTAG/SWD and Trace connector that carries the trace clock and four trace data lines. Targets with a 38-pin Mictor header connect through the J-Trace Mictor 38 Adapter. Pin assignments for the 20-pin connector are in our SEGGER J-Link 20-pin connector pinout guide. Supported debug interfaces are JTAG, cJTAG, SWD, SWD multi-drop and SWO, and the probe can supply 5V to the target.
Full J-Link PRO Debug Capability
J-Trace PRO Cortex is also a complete J-Link. It includes the full set of J-Link PRO licences, including Unlimited Flash Breakpoints, and supports Real Time Transfer (RTT) and monitor-mode debugging on ARMv7-M and ARMv8-M. SEGGER allows Ozone, its debugger and trace analysis tool, to be used free of charge with a J-Trace PRO, including for commercial use. Ozone is SEGGER's recommended tool for trace analysis; debugging works from any J-Link compatible IDE. Software runs on Windows, Linux and macOS, including ARM64 and Apple Silicon hosts.
The Ethernet data lines are isolated to IEEE 802.3 (1500 Vrms for one minute). The shield is not, so SEGGER recommends an unshielded twisted pair cable where that isolation matters.
What's Included
- J-Trace PRO Cortex probe
- Cortex-M Trace Reference Board
- 20-pin 0.05" target ribbon cable
- 20-pin 0.1" target ribbon cable
- Micro USB cable
- USB 3.0 cable
Specifications
| Host interface | USB 3.0 SuperSpeed; Gigabit Ethernet |
|---|---|
| Target interface | JTAG/SWD 20-pin (14-pin adapter available); JTAG/SWD + Trace 19-pin 0.05" (38-pin Mictor adapter available) |
| Trace | Streaming trace; ETM, PTM and ETB (ARM Cortex) |
| Supported cores | ARM Cortex-A, Cortex-R, Cortex-M, SC000, SC300 |
| Target interface voltage (VIF) | 1.2V to 5V |
| Target interface speed | Max. 50 MHz |
| Download speed | Up to 4.0 MB/s |
| Power supply | USB powered, max. 400mA |
| Reset type | Open drain with 100 Ohm series resistor, can be pulled low or tristated |
| Trace capacitive load | 3 pF J-Trace plus 8 pF cable (typical) |
| Dimensions (without cables) | 123mm x 68mm x 30mm |
| Weight (without cables) | 120g |
| Operating temperature | +5°C to +60°C |
| Storage temperature | -20°C to +65°C |
| Relative humidity | Max. 90% rH, non-condensing |
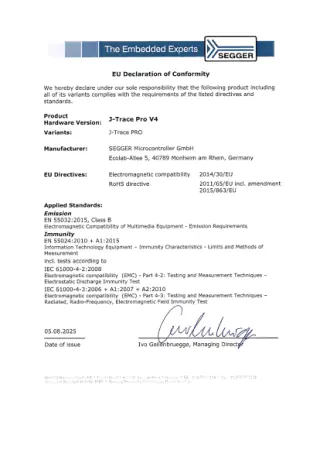
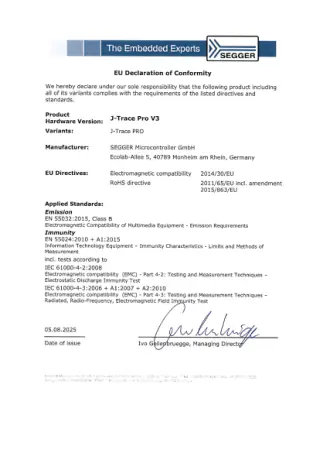
| EMC | EN 55022, EN 55024 |
| Host OS | Windows and Linux (x86-64, ARM64); macOS (x86-64, Apple Silicon) |
Limitations
- No RISC-V support; choose the J-Trace PRO or the J-Trace PRO RISC-V.
- Trace needs the target to implement trace hardware and bring the trace pins out to a connector; SEGGER notes that trace setup depends on the target hardware design.
- No VCOM and no CMSIS-DAP v1 (HID) mode.
- Most IDEs offer little or no trace analysis; plan on Ozone for coverage and profiling.
- The Mictor 38 adapter is a separate purchase.
J-Trace PRO Cortex Compared with the Other J-Trace PRO Models
| Model | Trace architectures | Cortex-M Trace Reference Board in box | Price ex VAT |
|---|---|---|---|
| J-Trace PRO Cortex (this product) | ARM Cortex-A, Cortex-R and Cortex-M | Yes | £2,005 |
| J-Trace PRO | ARM Cortex-A, Cortex-R, Cortex-M and RISC-V | Yes | £3,005 |
| J-Trace PRO Cortex-M | ARM Cortex-M | Yes | £1,515 |
| J-Trace PRO RISC-V | RISC-V (RV32, RV64) | Not listed | £2,005 |
Typical Applications
PTM trace on a Cortex-A9, or ETM trace on a Cortex-A53, application processor to follow program flow into a crash. ETM trace on a Cortex-R5 or Cortex-R52 real-time core to measure interrupt timing over a long run. Live code coverage on a Cortex-M4 or Cortex-M33 microcontroller to show which paths a test suite exercised.
Choose the J-Trace PRO Cortex when your targets include Cortex-A or Cortex-R cores; for Cortex-M only work, compare the J-Trace PRO Cortex-M.
Order the J-Trace PRO Cortex for £2,005 ex VAT. Check your device's trace pins, or ask us for a formal quotation. See the full range in our SEGGER debug probes collection.
Last reviewed 16/11/2026.
| General | |
|---|---|
| Reset type | Open drain with 100 Ohm series resistor, can be pulled low or tristated |
| Host and Target Interface | |
| Host interface | USB 3.0 SuperSpeed; Gigabit Ethernet |
| Target interface | JTAG/SWD 20-pin (14-pin adapter available); JTAG/SWD + Trace 19-pin 0.05" (38-pin Mictor adapter available) |
| Target interface voltage (VIF) | 1.2V to 5V |
| Performance | |
| Trace | Streaming trace; ETM, PTM and ETB (ARM Cortex) |
| Target interface speed | Max. 50 MHz |
| Download speed | Up to 4.0 MB/s |
| Trace capacitive load | 3 pF J-Trace plus 8 pF cable (typical) |
| Power | |
| Power supply | USB powered, max. 400mA |
| Software and Compatibility | |
| Supported cores | ARM Cortex-A, Cortex-R, Cortex-M, SC000, SC300 |
| Host OS | Windows and Linux (x86-64, ARM64); macOS (x86-64, Apple Silicon) |
| Physical | |
| Dimensions (without cables) | 123mm x 68mm x 30mm |
| Weight (without cables) | 120g |
| Environmental | |
| Operating temperature | +5°C to +60°C |
| Storage temperature | -20°C to +65°C |
| Relative humidity | Max. 90% rH, non-condensing |
| EMC | EN 55022, EN 55024 |
| Ordering information | |
| Part number (SKU) | 8.20.00 |
| Manufacturer | SEGGER Microcontroller GmbH |
| EAN | 5055383619535 |
| Warranty | 12 mois |
| Shipping weight | 1.0 kg |
- 1 ×J-Trace PRO Cortex-A/R/M trace probe
- 1 ×Cortex-M Reference Board
- 1 ×20-pin, 0.05" target ribbon cable
- 1 ×20-pin, 0.1" target ribbon cable
- 1 ×Micro USB cable
- 1 ×USB 3.0 cable
Débogueur de traces Cortex SEGGER J-Trace PRO compared with Débogueur de traces SEGGER J-Trace PRO Cortex-M , SEGGER J-Trace PRO RISC-V Debug Probe and SEGGER J-Trace PRO Trace Probe on 15 specifications.
| Specification | This product Débogueur de traces Cortex SEGGER J-Trace PRO8.20.00Available to order |
 Débogueur de traces SEGGER J-Trace PRO Cortex-M8.18.00In stock |
 SEGGER J-Trace PRO RISC-V Debug Probe8.22.00Available to order |
 SEGGER J-Trace PRO Trace Probe8.24.00Available to order |
|---|---|---|---|---|
| Debug architectures | ARM Cortex-A, Cortex-R and Cortex-M | ARM Cortex-M (incl. SC000, SC300) | RISC-V (RV32, RV64) | ARM Cortex-A/R/M, legacy ARM, ARM China STAR-MC, RISC-V, Cadence Tensilica, Microchip PIC32, Renesas RX and RH850, Silicon Labs EFM8 |
| ARM Cortex trace | ETM, PTM, ETB | ETM, ETB (Cortex-M only) | Not supported | ETM, PTM, ETB |
| RISC-V trace | Not supported | Not supported | N-Trace BTM | N-Trace BTM |
| Trace pins | 4-bit (TRACECLK, TRACEDATA[0..3]) on 19-pin 0.05" connector | 4-bit (TRACECLK, TRACEDATA[0..3]) on 19-pin 0.05" connector | 4-bit (TRACECLK, TRACEDATA[0..3]) on 19-pin 0.05" connector | 4-bit (TRACECLK, TRACEDATA[0..3]) on 19-pin 0.05" connector |
| Streaming trace | Supported | Supported | Supported | Supported |
| On-board trace buffer | 64 MB | 64 MB | 64 MB | 64 MB |
| Host interface | USB 3.0 SuperSpeed and Gigabit Ethernet | USB 3.0 SuperSpeed and Gigabit Ethernet | USB 3.0 SuperSpeed and Gigabit Ethernet | USB 3.0 SuperSpeed and Gigabit Ethernet |
| Target interface speed | Max. 50 MHz | Max. 50 MHz | Max. 50 MHz | Max. 50 MHz |
| Download speed | Up to 4 MB/s | Up to 4 MB/s | Up to 4 MB/s | Up to 4 MB/s |
| Target interface voltage (VIF) | 1.2 V to 5 V | 1.2 V to 5 V | 1.2 V to 5 V | 1.2 V to 5 V |
| SWO | Supported | Supported | Not supported | Supported |
| ARM monitor mode debugging | ARMv7-M and ARMv8-M | ARMv7-M and ARMv8-M | Not supported | ARMv7-M and ARMv8-M |
| 5 V target supply | Supported | Supported | Supported | Supported |
| Trace reference board in the box | Cortex-M Trace Reference Board | Cortex-M Trace Reference Board | Not included | Cortex-M Trace Reference Board |
| Software licences | Full set of J-Link PRO licences (incl. Unlimited Flash Breakpoints); Ozone included | Full set of J-Link PRO licences (incl. Unlimited Flash Breakpoints); Ozone included | Full set of J-Link PRO licences (incl. Unlimited Flash Breakpoints); Ozone included | Full set of J-Link PRO licences (incl. Unlimited Flash Breakpoints); Ozone included |
| Price | £2,005 | £1,515 | £2,005 | £3,005 |


 SEGGER AN00016 Analyzing HardFaults on Cortex-M CPUsSEGGER application note on finding the cause of HardFaults on Cortex-M devices using a HardFault handler and a debugger to...
 SEGGER AN08005 Using RTT on Cortex-A/R Based DevicesSEGGER application note on using Real Time Transfer (RTT) with J-Link on Cortex-A and Cortex-R devices.
 SEGGER AN00021 Connecting J-Link to STM32 Discovery BoardsSEGGER application note on connecting a J-Link to STM32 Discovery evaluation boards in place of the on-board ST-LINK.
Questions et réponses
-
Can the J-Trace PRO Cortex Be Used as a Normal J-Link Debug Probe?
Yes. It has all J-Link debug probe capabilities and the full set of J-Link PRO licences, including Unlimited Flash Breakpoints, and works with J-Link software and J-Link compatible IDEs.
-
What Is the Difference Between the J-Trace PRO Cortex and the J-Trace PRO Cortex-M?
Core support. SEGGER lists Cortex-A and Cortex-R cores and PTM trace for the Cortex model; the Cortex-M model supports Cortex-M cores only. Both share the same housing, host interfaces and target connectors.
-
What Does the Target Need for Trace?
The device must implement ETM or PTM trace and the trace clock and data pins must be wired to the 19-pin 0.05" connector or a Mictor header. SEGGER publishes a list of tested devices with ready-made example projects.
-
What Interfaces Does the J-Trace PRO Cortex Provide and Why Are They Advantageous?
It has two interfaces: SuperSpeed USB 3.0 and Gigabit Ethernet.
- USB 3.0 gives continuous streaming trace at full system clock and download speeds up to 4MB/s, avoiding the bottleneck of USB 2.0.
- Gigabit Ethernet allows remote debugging over a network, for targets in test chambers, production environments or other locations.
Remote debugging is available over Ethernet as well as USB; streaming trace uses the USB 3.0 interface. There are also two target connectors: a 20-pin debug connector and a combined 19-pin debug and trace connector. Only one target connector can be used at a time.
-
How Does Unlimited Flash Breakpoints Work in the J-Trace PRO Cortex?
Unlimited Flash Breakpoints lets you set as many breakpoints as you need when debugging code that runs from flash memory.
The probe uses hardware breakpoints first (typically 4 to 6 on Cortex-M), then switches to software breakpoints in flash once those are used up. It uses instruction set simulation, flash caching and selective sector reprogramming to minimise flash write cycles. In practice you won't notice when you've passed the hardware breakpoint limit, and debugging in flash feels much like debugging in RAM.
It works with internal and external flash, including memory-mapped QSPI flash where hardware breakpoints cannot be used. This matters when the application has to run from flash because there isn't enough RAM.
-
What Software Tools Are Included with the J-Trace PRO Cortex?
It comes with SEGGER's professional software suite at no extra cost:
- Ozone, a graphical debugger and performance analyser with trace visualisation, code profiling, coverage analysis and instruction-level debugging. It needs no additional licences.
- J-Flash and J-Flash SPI for high-speed programming of internal and external flash.
- J-Link Software and Documentation Package for Windows, macOS and Linux, with regular free updates.
The software works with popular IDEs including Keil, IAR, Embedded Studio and Eclipse through standard debugging interfaces.
-
Which Cortex Architectures and Devices Does the J-Trace PRO Cortex Support?
It supports Cortex-A, Cortex-R and Cortex-M architectures:
- Cortex-M: M0, M0+, M1, M3, M4, M7, M23 and M33
- Cortex-A: A5, A7, A8, A9, A12, A15 and A17
- Cortex-R: R4 and R5
The tested devices list covers manufacturers such as STMicroelectronics, NXP, Infineon, Atmel, AmbiqMicro and many others. SEGGER adds device support through regular software updates to the J-Link software package.
-
What Are the Power and Connectivity Specifications for the J-Trace PRO Cortex?
The J-Trace PRO Cortex is USB-powered (maximum 400mA), so most configurations need no external power supply. Other specifications:
- Target interface voltage: 1.2V to 5V
- Maximum trace clock: 150MHz
- Data input rise/fall time: maximum 20ns
- Clock rise/fall time: maximum 10ns
- Dimensions: 123mm × 68mm × 30mm
- Weight: 120g without cables
- Operating temperature: +5°C to +60°C
- Storage temperature: -20°C to +65°C
- EMC standards: EN 55022, EN 55024
-
What Is the Segger J-Trace PRO Cortex Debugger and What Makes It Unique?
The SEGGER J-Trace PRO Cortex is a professional streaming trace probe for Cortex-A/R/M-based microcontrollers. What sets it apart:
- SuperSpeed USB 3.0 interface for continuous, unlimited streaming trace with full trace clock support, so you aren't limited by internal buffers or slow data transfer
- 64MB on-board trace buffer
- All J-Link debug functionality combined with trace analysis
- Download speeds up to 4MB/s
-
How Does the J-Trace PRO Cortex Compare to Higher-end Competitors Like Lauterbach TRACE32?
The J-Trace PRO Cortex can be running within 15 minutes using SEGGER's Ozone debugger. In our experience, TRACE32 has a longer learning curve. The J-Trace PRO Cortex offers:
- Windows, macOS and Linux support
- SuperSpeed USB 3.0 and Gigabit Ethernet interfaces
- Streaming trace at full system clock with real-time analysis
- Live code profiling and coverage analysis
-
Can the J-Trace PRO Cortex Capture Infrequent, Hard-to-Reproduce Bugs?
Yes. Its unlimited streaming trace can record complete traces over hours or even days, so you can catch intermittent faults that a buffer-limited debugger would miss.
When program flow "runs off the rails" and stops in a fault state, you get the trace data leading up to the failure. Continuous streaming via USB 3.0 runs at the full trace clock with no limit on the amount of trace data, and the 64MB on-board buffer adds extra margin. This helps with systems using communication stacks such as Ethernet or USB, where bugs may only appear under specific timing conditions or after long operation.
-
What Trace Analysis Features Does the J-Trace PRO Cortex Provide for Code Optimisation?
It provides Live Code Profiling and Live Code Coverage, shown in the Ozone debugger.
- Live Code Profiling shows in real time which instructions execute and how often, so you can find performance hotspots.
- Live Code Coverage shows at instruction level which parts of the code have run, which helps with regulatory requirements and thorough testing.
- Ozone displays execution counters live alongside the source code as the application runs.
- Instruction-level trace lets you verify code paths, analyse function call durations and measure CPU load per function.
All trace data can be exported for further analysis or compliance documentation, for example on safety-critical projects.
-
Does the J-Trace PRO Cortex Support Multi-Core Debugging?
Yes. Multiple debuggers or debugger instances can use the same J-Trace PRO at the same time, so you can debug different cores on a multi-core target in parallel.
You only need to set up the scan chain correctly for each debugger instance. No special multi-core settings are needed. This suits multi-core Cortex-A and Cortex-R processors. Whether trace is available, and on which cores, depends on the device's trace implementation.

No questions match your search.
