

SEGGER Microcontroller GmbH
Débogueur de traces SEGGER J-Trace PRO Cortex-M
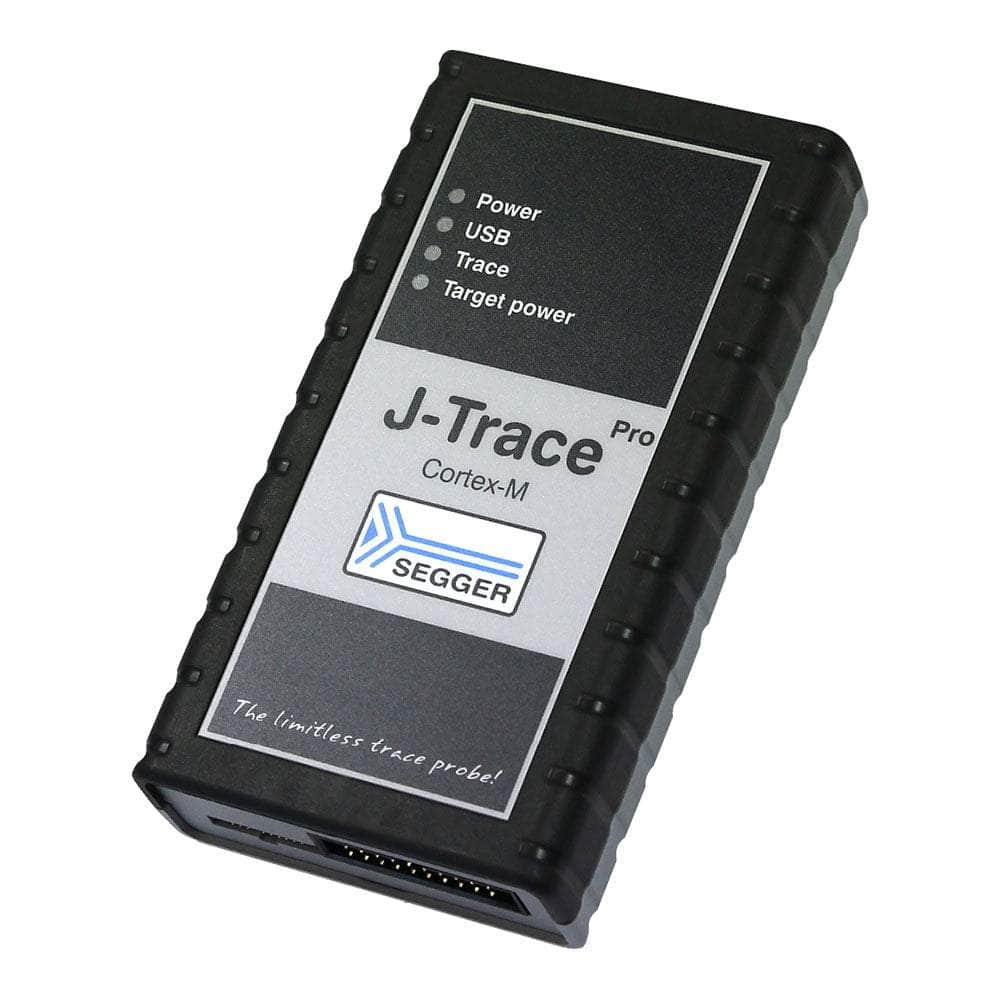
Débogueur de traces SEGGER J-Trace PRO Cortex-M
SKU: 8.18.00
Impossible de charger la disponibilité du service de retrait


Key Features
Overview
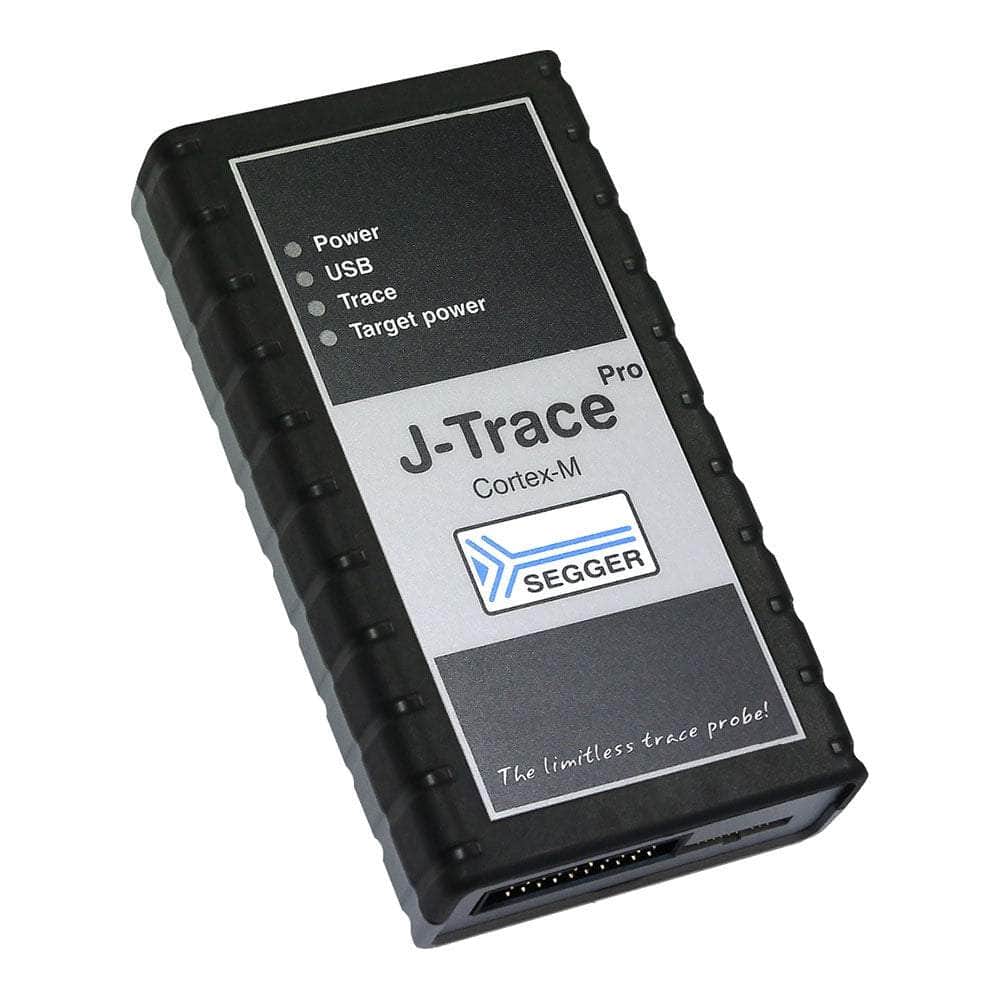
The J-Trace PRO Cortex-M is SEGGER's specialised streaming trace probe designed specifically for ARM Cortex-M microcontrollers. Unlike traditional trace solutions limited by internal buffer sizes, this probe enables unlimited real-time instruction tracing through SuperSpeed USB 3.0 and Gigabit Ethernet interfaces.
Where It Fits
- Cortex-M Specific J-Trace PRO Cortex (Multi-Core)
- All Architectures J-Trace PRO Universal
Why It Matters
| Feature | Why It's Important | What You Gain |
|---|---|---|
| Streaming Trace | No buffer limitations | Capture months of trace data continuously |
| Live Analysis | Real-time insights | Debug whilst target runs at full speed |
| ETM Support | Complete instruction visibility | See every executed instruction with timing |
Wiring Quick-Start
| Host | Direction | Through | Device | Notes |
|---|---|---|---|---|
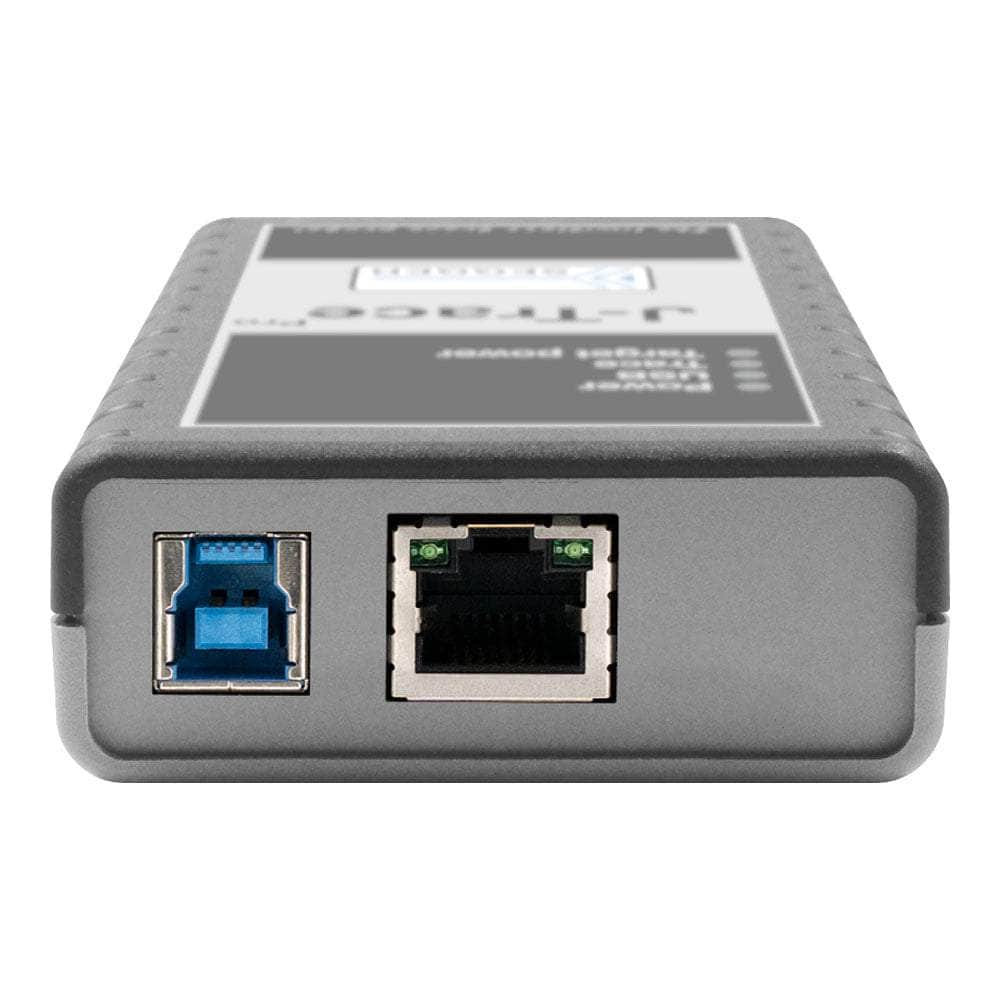
| USB 3.0 Port | → | USB Cable | J-Trace USB Port | SuperSpeed for streaming |
| Ethernet Port | → | Cat5/6 Cable | J-Trace LAN Port | Alternative connection |
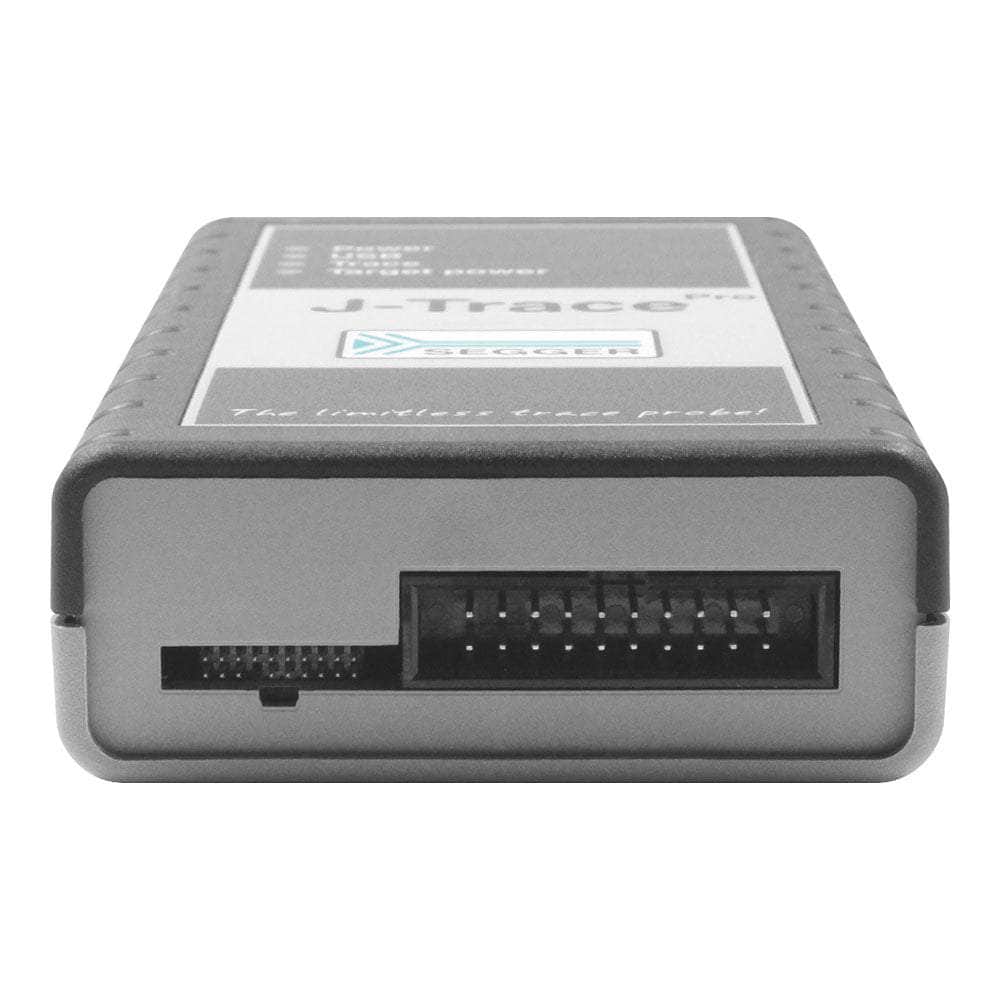
| J-Trace Target | → | 20-pin Ribbon | MCU Debug Header | JTAG/SWD signals |
| J-Trace Trace | → | 0.05" Connector | MCU Trace Pins | ETM trace data |
Code Snippet
// Cortex-M4 ETM trace setup example #define ETM_BASE 0xE0041000 #define TPIU_BASE 0xE0040000
void setup_trace(void) {
// Enable trace clock
CoreDebug->DEMCR |= CoreDebug_DEMCR_TRCENA_Msk;

Data format:

text
// Configure ETM for instruction trace
ETM->CR = 0x00000D1E;  // Enable ETM
ETM->TRIGGER = 0x406F; // Trigger events

// Setup TPIU for external trace
TPIU->SPPR = 0x00000002; // NRZ protocol
TPIU->ACPR = 0x0000000F; // Trace clock prescaler
}
Downloads
Présentation de SEGGER J-Trace PRO : la sonde de traçage en streaming ultime
Vous êtes un développeur embarqué à la recherche de la solution de débogage parfaite ? Ne cherchez plus ! SEGGER J-Trace est là pour répondre à tous vos besoins de débogage avec ses fonctionnalités inégalées et son expérience de traçage transparente.
Libérez la puissance du streaming illimité Trace
Avec SEGGER J-Trace, vous pouvez accéder à un suivi en continu illimité, en capturant des traces complètes sur de longues périodes. Ne passez plus à côté de ces bugs insaisissables qui apparaissent de nulle part ! Enregistrez et analysez facilement les bugs peu fréquents et difficiles à reproduire, même lorsque le flux de votre programme déraille et s'arrête dans un état d'erreur.
Couverture et profilage du code en direct à portée de main
J-Trace PRO prend en charge des fonctionnalités étendues telles que Live Code Coverage et Live Code Profiling au-delà des sondes de trace traditionnelles. Gardez un œil sur les parties de votre code d'application qui ont été exécutées avec Live Code Coverage et obtenez des informations précieuses sur la fréquence d'exécution des instructions avec Live Code Profiling. Identifiez les points chauds dans votre code pour des opportunités d'optimisation et rationalisez votre processus de développement.
Prise en charge des microcontrôleurs basés sur Cortex-M
La variante J-Trace PRO Cortex-M offre une prise en charge transparente des microcontrôleurs basés sur Cortex-M. Son interface USB 3.0 SuperSpeed permet un suivi en continu via USB avec l'horloge de suivi complète. Cette fonction de streaming en temps réel vous permet de capturer des données sur des périodes prolongées sans restrictions, vous offrant ainsi toutes les informations dont vous avez besoin pour développer et optimiser efficacement votre code.
Profitez de l'expérience de débogage ultime ! Adoptez SEGGER J-Trace dès aujourd'hui et élevez votre processus de développement embarqué vers de nouveaux sommets !
| General Information | |
|---|---|
Part Number (SKU) |
8.18.00
|
Manufacturer |
|
| Physical and Mechanical | |
Weight |
0.5 kg
|
| Other | |
EAN |
5055383615353
|
Frequently Asked Questions
Have a Question?
-
What's included in the box with the J-Trace PRO Cortex-M?
The package includes the J-Trace PRO hardware, USB 3.0 cable, Ethernet cable, 20-pin 0.1" JTAG/SWD ribbon cable, 20-pin 0.05" trace cable, and software licenses for Ozone debugger and J-Flash programmer.
-
Is the J-Trace PRO Cortex-M compatible with multi-core systems?
This model focuses on single Cortex-M core tracing. For multi-core ARM systems or mixed architectures, consider the <a href="">J-Trace PRO Universal.
-
What trace analysis features does the included Ozone debugger provide?
Ozone offers live code profiling (execution timing and hotspot analysis), live code coverage (instruction-level coverage tracking), and historical trace browsing with source code correlation.
-
Can I debug remotely over Ethernet?
Yes, the integrated Gigabit Ethernet interface enables remote debugging across networks. This is particularly useful for accessing targets in test environments or when the development PC cannot be physically connected.
-
How fast is the flash programming compared to standard J-Link?
The J-Trace PRO achieves up to 4MB/s download speeds, significantly faster than standard debug probes. This reduces development iteration time when loading large applications or frequent code updates.
-
Do I need special target hardware modifications for trace?
Your target must expose the ETM trace pins (typically TRACECLK and TRACEDATA[3:0]) on a connector. Many development boards include these signals on debug headers. No target code modifications are required.
-
What's the difference between this and the regular J-Trace PRO?
The Cortex-M model is optimised specifically for Cortex-M cores and costs less than the universal J-Trace PRO. The universal model additionally supports Cortex-A, Cortex-R, and RISC-V architectures.
-
Can I use the J-Trace PRO Cortex-M with my existing IDE?
Yes, it integrates with all major development environments including IAR Embedded Workbench, Keil µVision, Eclipse-based IDEs, and GCC toolchains. The included Ozone debugger works independently of any IDE.
-
How does streaming trace differ from traditional trace buffers?
Traditional trace probes capture limited data in internal buffers (typically 4-32MB). Streaming trace continuously transfers data to the host PC via USB 3.0 or Ethernet, enabling unlimited capture periods without data loss.
-
What ARM Cortex-M cores does the J-Trace PRO Cortex-M support?
The probe supports all ARM Cortex-M variants including M0, M0+, M1, M3, M4, M7, M23, M33, M52, M55, and M85 cores. It works with any Cortex-M microcontroller that provides ETM trace output pins.