Overview
The Total Phase eSPI Bus Monitor includes everything needed to Monitor and Analyse the Enhanced Serial Peripheral Interface (eSPI). The eSPI bus has been developed by Intel.
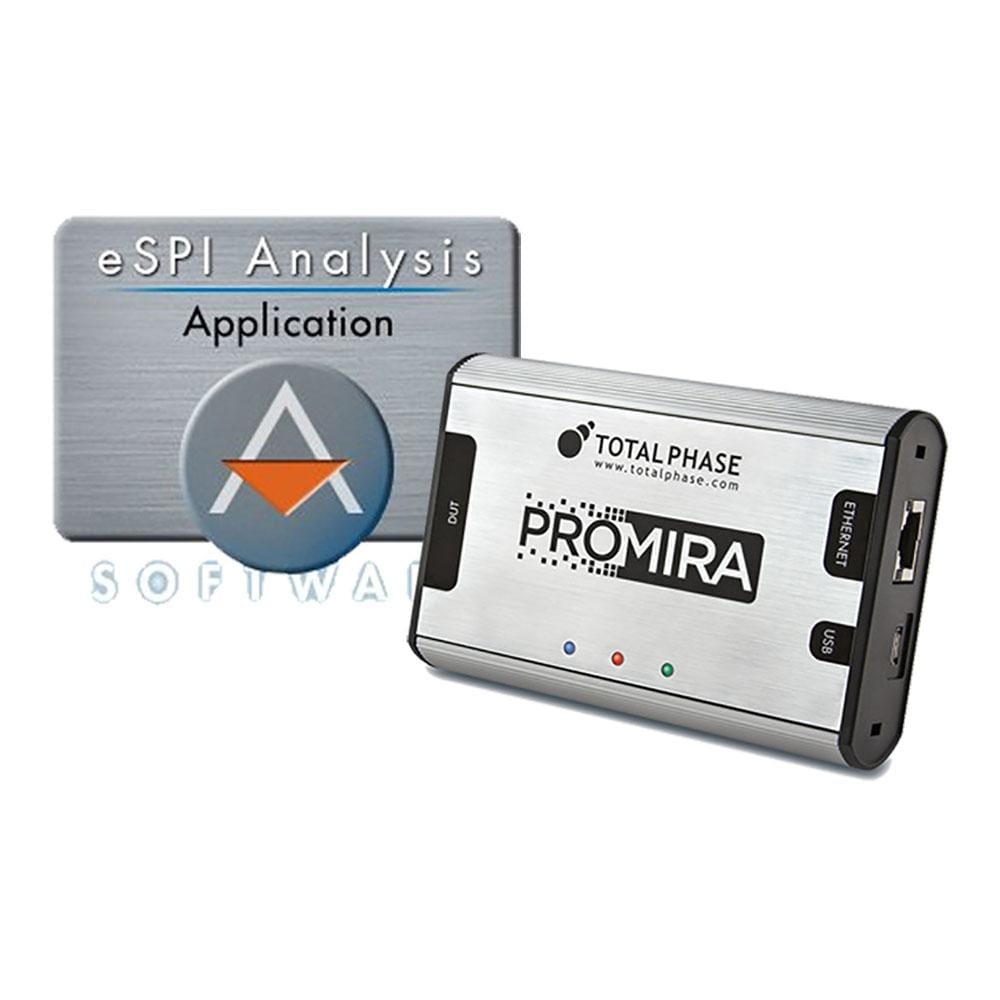
The eSPI Bus Analyser Kit includes the Total Phase PROMIRA™, a high-performance tool for stimulating and analysing serial buses, an eSPI Analysis, application, and the Data Centre Bus Analyser Software.
Downloads
First released by Intel in June 2013, the Enhanced Serial Peripheral Interface (eSPI®) is designed as a replacement for the Low Pin Count (LPC) bus. eSPI®supports communication between Embedded Controller (EC), Baseboard Management Controller (BMC), Super-I/O (SIO) and Port-80 debug cards. eSPI®was vailable in the Sky Lake chipset (2015) and is available in the Kaby Lake [current] chipset. Cannonlake will support eSPI®and is slated for release the second half of 2017. Icelake is scheduled for release in 2019 and it will mark the first chipset when eSPI®becomes mandatory.
Prior to this specification, Embedded Controller (EC), Baseboard Management Controller (BMC) and Super I/O (SIO) were connected to the chipset through the Low Pin Count (LPC) bus.
PROMIRA™ Serial Platform
The PROMIRA™ Serial Platform is a powerful, fast and configurable engine for both driving serial buses and monitoring buses, non-intrusively, in real-time.
.
eSPI®Analysis Application

The Total Phase eSPI®Analysis Application is the first eSPI®monitor in the industry. With this application you will be able to monitor eSPI®communication between multiple eSPI®devices:.
- Monitor communication between a master and slaves on data lines
- Support for single, dual and quad I/O
- Support for clock speeds up to 66MHz
- Monitor up to 5 channels (peripheral, virtual wire, OOB, Flash, Independent)
- Monitor up to 2 slave select lines
- Monitor 2 alert lines
- Monitor 2 reset lines
- Match triggers, hardware filters and statistics
LiveDisplay Technology
View eSPI®traffic as it is generated on the bus in true real time. Shorten debugging and development time by seeing data as they happen.
Frequently Asked Questions
Have a Question?
-
Is there an API for integrating the eSPI Analyser with custom test setups?
Yes, a 32/64-bit software API is available for C, C#, Python, .NET, and VB.NET, allowing custom integration and automation of tests or analysis tasks.
-
Does the Analyser support triggering or match-action features for capturing precise conditions?
Yes, the tool has advanced match/trigger options. You can configure triggers for non-posted transactions, errors, or specific data patterns using the Match/Action system.
-
Can the eSPI Analyser capture and organize complex transactions for easier debugging?
Yes, captured data is visualized in a hierarchical, tree-structured view. Transactions are grouped and expandable, making navigation and understanding easier
-
How do I filter or search for specific traffic or events on the eSPI bus?
You can use LiveFilter to filter by indices, errors, endpoints, device addresses, PIDs, and patterns. LiveSearch allows searching for text, hex, or ASCII data to easily locate events.
-
What operating systems are compatible with the eSPI Analysis Application?
The application, via Data Center Software, is compatible with Windows, Linux, and Mac OS X platforms.
-
Does the eSPI Analyser support real-time analysis?
Yes, with features like LiveDisplay, LiveFilter, and LiveSearch in the Data Center Software, you can view, filter, and search eSPI traffic in true real time as it's captured.
-
Which eSPI features and modes are supported?
The Analyser supports Single, Dual, and Quad I/O modes, monitoring at speeds up to 66MHz. It tracks all eSPI transaction types and phases, including command, turn-around, and response, as defined by the eSPI specification.
-
What is the Total Phase eSPI Analyser, and what does it do?
The eSPI Analyser is a protocol analysis solution running on the Promira Serial Platform. It enables engineers to non-intrusively capture, display, and monitor Enhanced Serial Peripheral Interface (eSPI) communication, providing real-time visibility into eSPI traffic between master and slave devices.


