

SEGGER Microcontroller GmbH
SEGGER J-Trace PRO Cortex-M Streaming Trace Debugger (8.18.00)
SEGGER J-Trace PRO Cortex-M Streaming Trace Debugger (8.18.00)
SKU: 8.18.00
Couldn't load pickup availability


Key Features
Overview
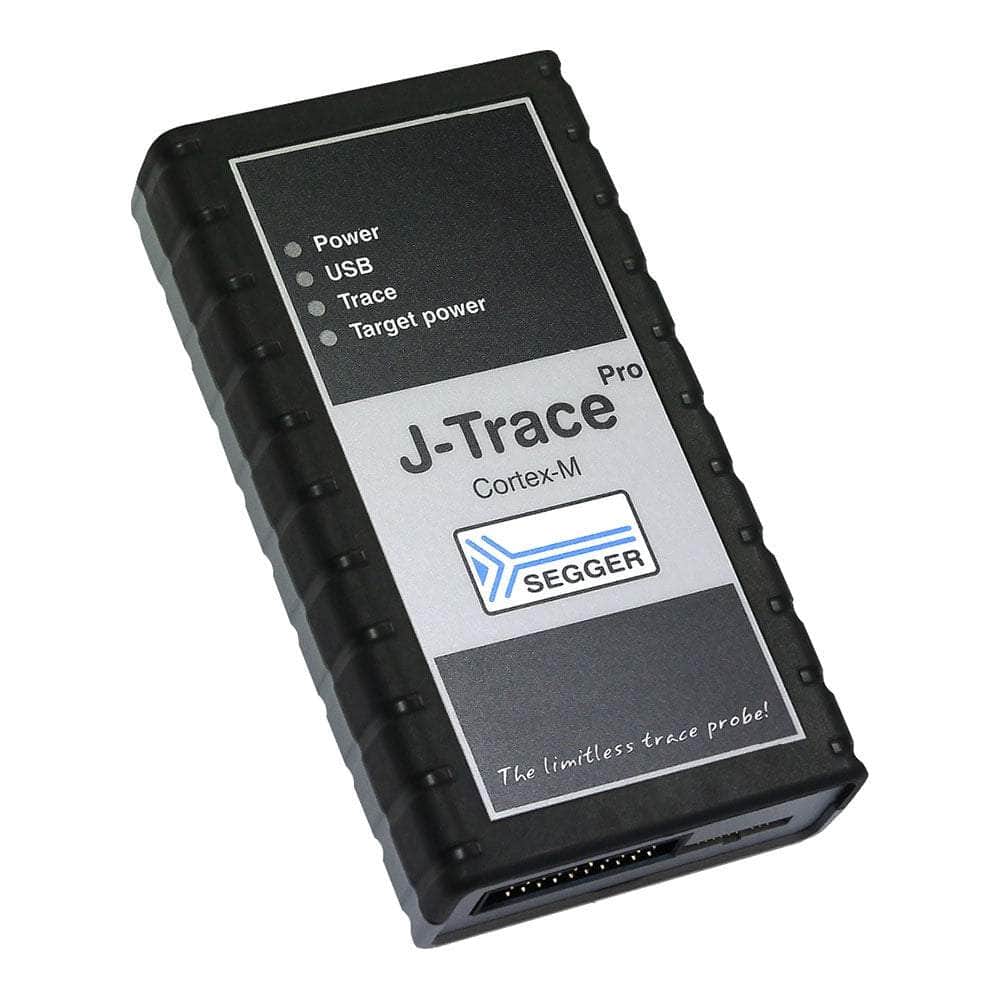
The J-Trace PRO Cortex-M is SEGGER's specialised streaming trace probe designed specifically for ARM Cortex-M microcontrollers. Unlike traditional trace solutions limited by internal buffer sizes, this probe enables unlimited real-time instruction tracing through SuperSpeed USB 3.0 and Gigabit Ethernet interfaces.
Where It Fits
- Cortex-M Specific J-Trace PRO Cortex (Multi-Core)
- All Architectures J-Trace PRO Universal
Why It Matters
| Feature | Why It's Important | What You Gain |
|---|---|---|
| Streaming Trace | No buffer limitations | Capture months of trace data continuously |
| Live Analysis | Real-time insights | Debug whilst target runs at full speed |
| ETM Support | Complete instruction visibility | See every executed instruction with timing |
Wiring Quick-Start
| Host | Direction | Through | Device | Notes |
|---|---|---|---|---|
| USB 3.0 Port | → | USB Cable | J-Trace USB Port | SuperSpeed for streaming |
| Ethernet Port | → | Cat5/6 Cable | J-Trace LAN Port | Alternative connection |
| J-Trace Target | → | 20-pin Ribbon | MCU Debug Header | JTAG/SWD signals |
| J-Trace Trace | → | 0.05" Connector | MCU Trace Pins | ETM trace data |
Code Snippet
// Cortex-M4 ETM trace setup example #define ETM_BASE 0xE0041000 #define TPIU_BASE 0xE0040000
void setup_trace(void) {
// Enable trace clock
CoreDebug->DEMCR |= CoreDebug_DEMCR_TRCENA_Msk;

Data format:

text
// Configure ETM for instruction trace
ETM->CR = 0x00000D1E;  // Enable ETM
ETM->TRIGGER = 0x406F; // Trigger events

// Setup TPIU for external trace
TPIU->SPPR = 0x00000002; // NRZ protocol
TPIU->ACPR = 0x0000000F; // Trace clock prescaler
}
Downloads
Professional ARM Cortex-M Trace Debugging
The SEGGER J-Trace PRO Cortex-M represents a significant advancement in ARM Cortex-M debugging technology. Unlike conventional debug probes that rely on limited internal trace buffers, this professional instrument provides unlimited streaming trace capabilities through high-speed SuperSpeed USB 3.0 and Gigabit Ethernet interfaces.
Streaming Trace Technology
Traditional trace solutions capture instruction data in finite internal buffers, typically 4-32MB, which fills rapidly at high CPU frequencies. The J-Trace PRO Cortex-M eliminates this constraint by continuously streaming trace data to the host computer in real-time. This enables capture periods extending from minutes to months without data loss.
ETM Instruction Tracing
ARM Cortex-M cores with Embedded Trace Macrocell (ETM) capability output detailed instruction execution information through dedicated trace pins. The J-Trace PRO captures this data at up to 150MHz trace clock frequencies, providing complete visibility into program execution flow.
| Trace Type | Information Captured | Use Cases |
|---|---|---|
| Instruction Trace | Every executed instruction with timing | Program flow analysis, performance profiling |
| Data Trace | Memory read/write operations | Data flow debugging, cache analysis |
| Exception Trace | Interrupt and exception handling | RTOS debugging, timing analysis |
Live Analysis Capabilities
The streaming trace architecture enables sophisticated real-time analysis whilst the target executes at full speed. The included Ozone debugger processes trace data as it arrives, providing immediate insights into system behaviour.
Live Code Profiling
Execution profiling operates continuously without target performance impact. The system identifies function execution times, call frequencies, and performance bottlenecks in real-time. Engineers can observe hotspots developing during extended test runs and optimise accordingly.
Live Code Coverage
Instruction-level code coverage monitoring tracks which portions of the application execute during testing. This feature proves essential for safety-critical applications requiring verification that all code paths have been exercised according to regulatory standards such as DO-178C or ISO 26262.
Hardware Architecture
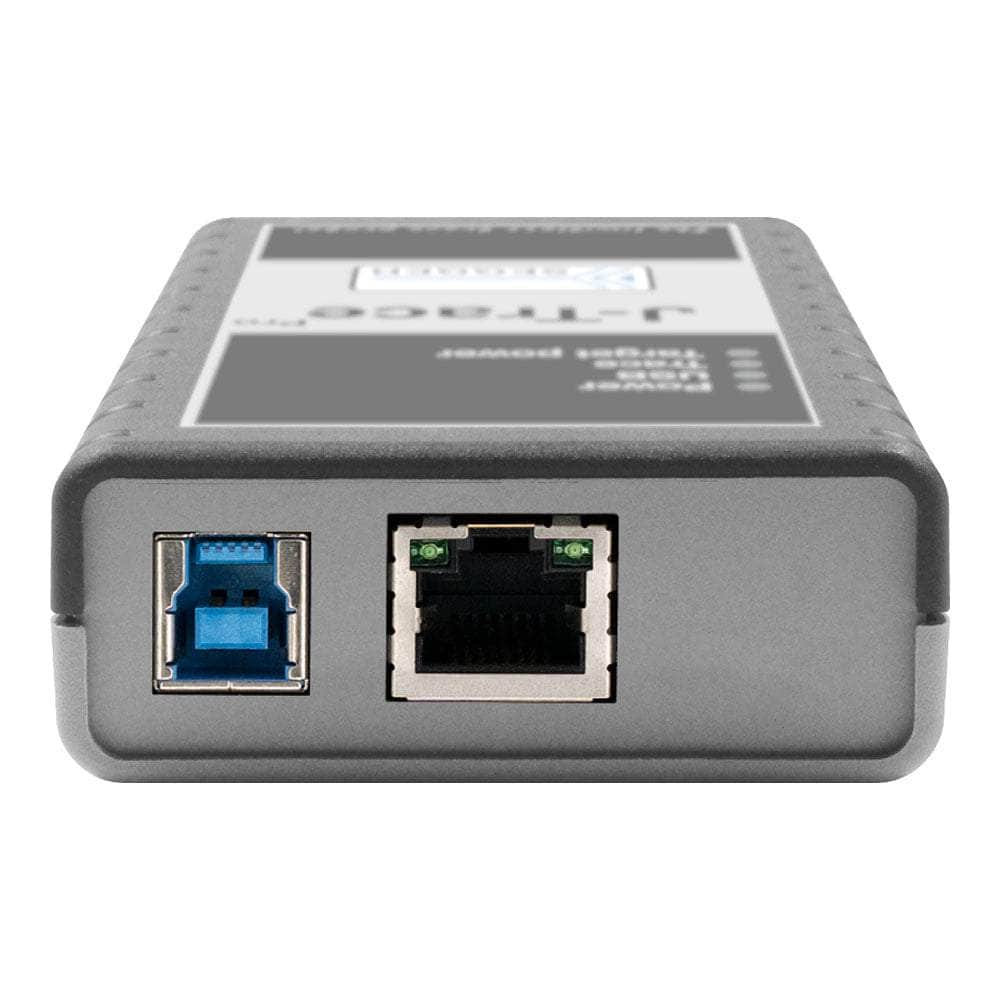
The J-Trace PRO Cortex-M features dual high-speed interfaces for maximum flexibility. SuperSpeed USB 3.0 provides up to 5Gbps bandwidth for streaming trace data, whilst the Gigabit Ethernet interface enables remote debugging scenarios.
| Interface | Bandwidth | Use Case | Benefits |
|---|---|---|---|
| USB 3.0 | 5 Gbps | Direct PC connection | Highest bandwidth, simple setup |
| Gigabit Ethernet | 1 Gbps | Remote debugging | Network access, isolation from EMI |
Target Interface Specifications
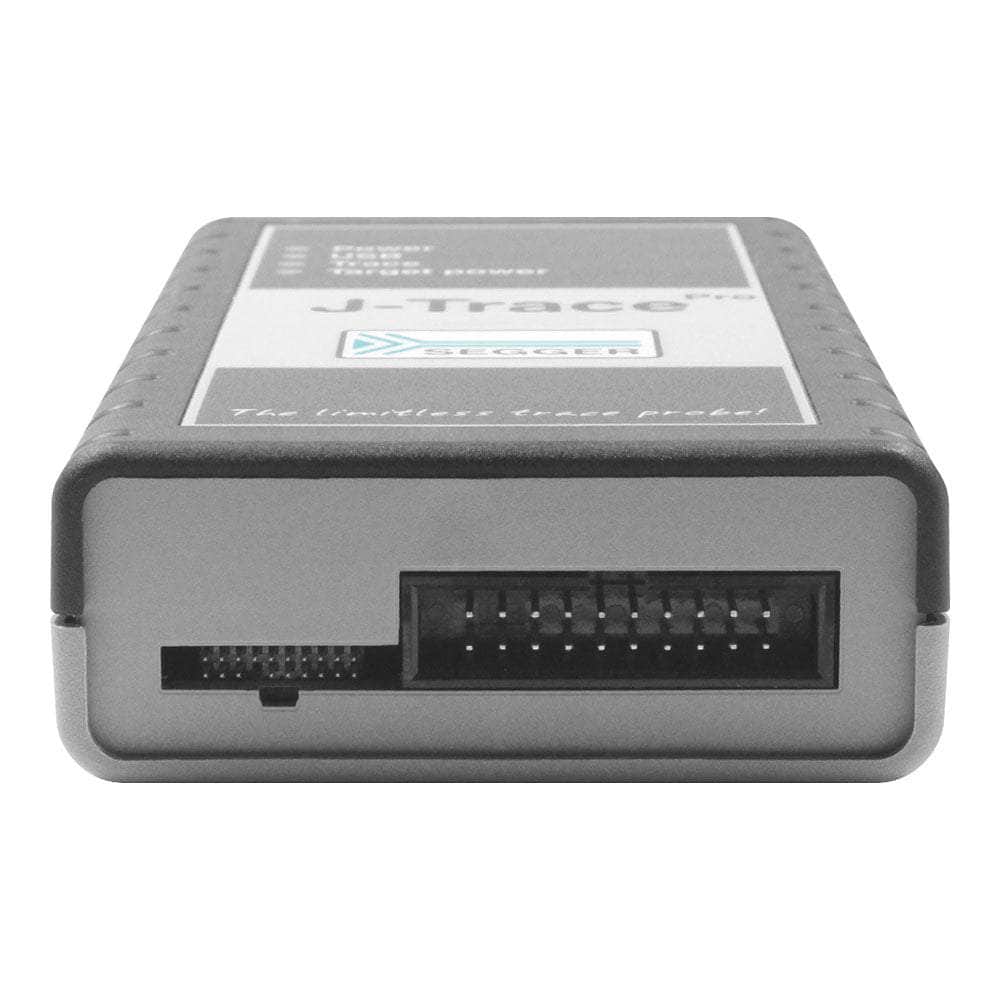
The probe provides separate connectors for debug and trace signals. The debug connector supports standard JTAG and SWD protocols at up to 50MHz clock frequencies. The dedicated trace connector handles high-speed ETM data capture.
Debug Connector (20-pin 0.1")
- JTAG: TDI, TDO, TCK, TMS, TRST
- SWD: SWDIO, SWDCLK
- Power: VTref, VCPout, Reset
- Control: nSRST, RTCK
Trace Connector (20-pin 0.05")
- Trace Clock: TRACECLK
- Trace Data: TRACEDATA[3:0]
- SWO: Single Wire Output
- Power and Ground
Software Integration
The J-Trace PRO Cortex-M integrates seamlessly with existing development workflows. The probe operates with all major toolchains and IDEs through standard GDB remote protocol support.
Included Software
- Ozone Debugger: Professional graphical debugger with trace analysis
- J-Flash: High-speed flash programming utility
- J-Link GDB Server: GDB remote protocol server
- RTT Client: Real-Time Transfer communication tool
IDE Compatibility
| Development Environment | Integration Method | Trace Support |
|---|---|---|
| IAR Embedded Workbench | Native plugin | Full ETM analysis |
| Keil µVision MDK | Native plugin | Complete trace features |
| Eclipse CDT | GDB remote protocol | Basic trace viewing |
| Visual Studio Code | Cortex-Debug extension | Trace data export |
Performance Specifications
Key Performance Metrics
- Maximum trace clock frequency: 150 MHz
- Flash programming speed: Up to 4.0 MB/s
- Target interface speed: Up to 50 MHz
- SWO speed: Up to 100 MHz
- Maximum CPU frequency: Unlimited
Trace Setup Example
Setting up streaming trace typically requires minimal target modifications. Most development boards expose trace pins on debug connectors.
// STM32F4 ETM configuration example void configure_etm_trace(void) { // Enable trace and debug clocks RCC->AHB1ENR |= RCC_AHB1ENR_ETMEN; CoreDebug->DEMCR |= CoreDebug_DEMCR_TRCENA_Msk; // Configure trace pins (PE2-PE6) GPIOE->MODER |= (2 << 4) | (2 << 6) | (2 << 8) | (2 << 10) | (2 << 12); GPIOE->AFR |= (0 << 8) | (0 << 12) | (0 << 16) | (0 << 20) | (0 << 24); // Setup ETM for instruction trace ETM->CR = ETM_CR_ETMEN | ETM_CR_PROGBIT; ETM->TRIGGER = 0x406F; ETM->SR = 0x00000002; // Configure TPIU for parallel trace output TPIU->CSPSR = 0x00000008; // 4-bit trace port TPIU->ACPR = (SystemCoreClock / 2000000) - 1; // 2MHz trace clock TPIU->SPPR = 0x00000000; // Parallel trace protocol TPIU->FFCR = 0x00000100; // Formatter enabled } Advanced Debugging Scenarios
The unlimited trace capture capability enables debugging scenarios impossible with traditional tools. Engineers can capture complete system execution over extended periods, then analyse the data to identify infrequent bugs or performance degradation patterns.
Hard-to-Reproduce Bug Analysis
Intermittent faults that occur after hours or days of operation can be captured and analysed. The trace data provides complete visibility into the sequence of events leading to the fault condition.
Performance Regression Testing
Long-term performance monitoring identifies gradual degradation in system performance. The live profiling features highlight when functions begin consuming excessive CPU time.
Real-Time System Analysis
RTOS-based applications benefit from complete task switching visibility. The trace data reveals scheduling behaviour, interrupt latencies, and resource contention issues.
| General Information | |
|---|---|
Part Number (SKU) |
8.18.00
|
Manufacturer |
|
| Physical and Mechanical | |
Weight |
0.5 kg
|
| Other | |
EAN |
5055383615353
|
Frequently Asked Questions
Have a Question?
-
What's included in the box with the J-Trace PRO Cortex-M?
The package includes the J-Trace PRO hardware, USB 3.0 cable, Ethernet cable, 20-pin 0.1" JTAG/SWD ribbon cable, 20-pin 0.05" trace cable, and software licenses for Ozone debugger and J-Flash programmer.
-
Is the J-Trace PRO Cortex-M compatible with multi-core systems?
This model focuses on single Cortex-M core tracing. For multi-core ARM systems or mixed architectures, consider the <a href="">J-Trace PRO Universal.
-
What trace analysis features does the included Ozone debugger provide?
Ozone offers live code profiling (execution timing and hotspot analysis), live code coverage (instruction-level coverage tracking), and historical trace browsing with source code correlation.
-
Can I debug remotely over Ethernet?
Yes, the integrated Gigabit Ethernet interface enables remote debugging across networks. This is particularly useful for accessing targets in test environments or when the development PC cannot be physically connected.
-
How fast is the flash programming compared to standard J-Link?
The J-Trace PRO achieves up to 4MB/s download speeds, significantly faster than standard debug probes. This reduces development iteration time when loading large applications or frequent code updates.
-
Do I need special target hardware modifications for trace?
Your target must expose the ETM trace pins (typically TRACECLK and TRACEDATA[3:0]) on a connector. Many development boards include these signals on debug headers. No target code modifications are required.
-
What's the difference between this and the regular J-Trace PRO?
The Cortex-M model is optimised specifically for Cortex-M cores and costs less than the universal J-Trace PRO. The universal model additionally supports Cortex-A, Cortex-R, and RISC-V architectures.
-
Can I use the J-Trace PRO Cortex-M with my existing IDE?
Yes, it integrates with all major development environments including IAR Embedded Workbench, Keil µVision, Eclipse-based IDEs, and GCC toolchains. The included Ozone debugger works independently of any IDE.
-
How does streaming trace differ from traditional trace buffers?
Traditional trace probes capture limited data in internal buffers (typically 4-32MB). Streaming trace continuously transfers data to the host PC via USB 3.0 or Ethernet, enabling unlimited capture periods without data loss.
-
What ARM Cortex-M cores does the J-Trace PRO Cortex-M support?
The probe supports all ARM Cortex-M variants including M0, M0+, M1, M3, M4, M7, M23, M33, M52, M55, and M85 cores. It works with any Cortex-M microcontroller that provides ETM trace output pins.