


Active Firmware Tools
Active-Plus Debugger and Logic Analyser
Active-Plus Debugger and Logic Analyser
SKU: APL-FD
Couldn't load pickup availability
Key Features
Overview
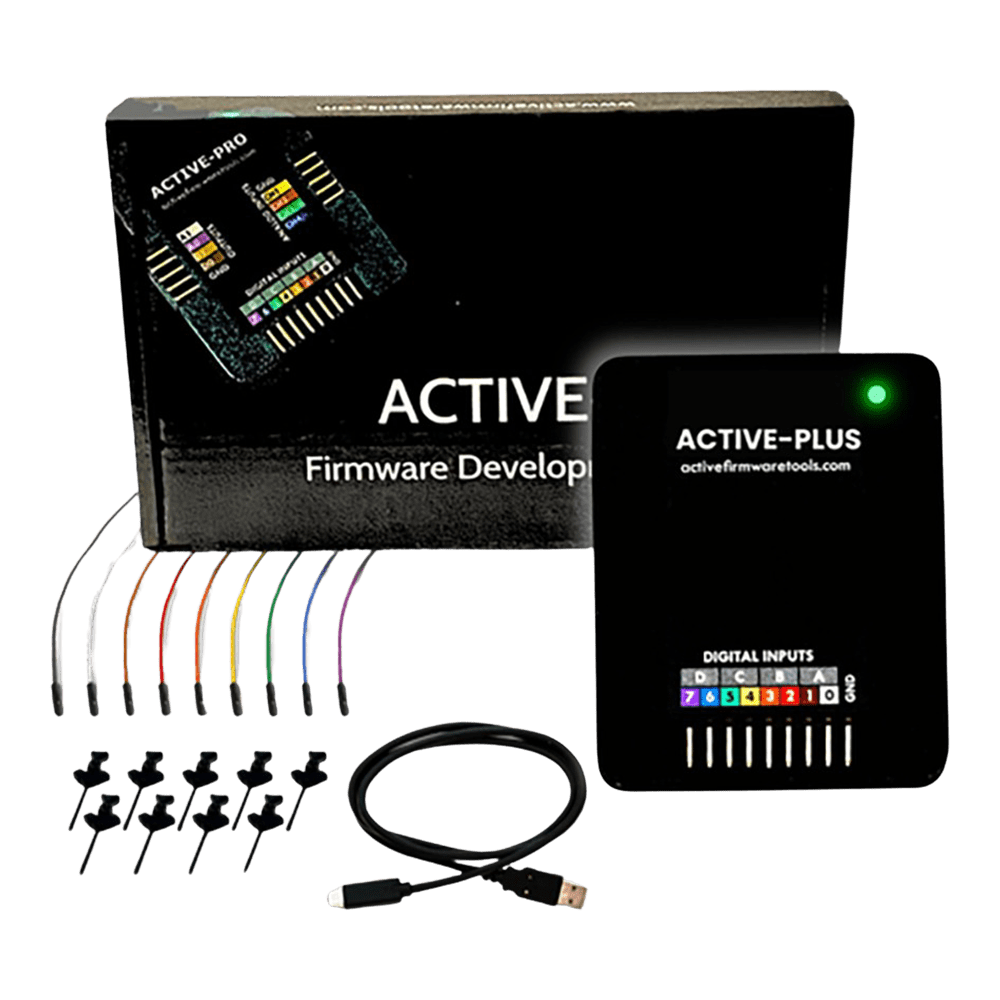
The Active-Plus Debugger and Logic Analyzer is a compact, versatile tool for embedded developers. This all-in-one device supports various microcontrollers and CPUs, including ARM Cortex-M, RISC-V, and Xtensa.
Compatible with popular IDEs, the Active-Plus offers protocol decoding for UART, SPI, and I2C. Its upgradeable firmware and software package for multiple platforms ensure future-proof performance. This powerful tool streamlines debugging, accelerating development workflows for electronic engineers in both lab and field settings.
| General Information | |
|---|---|
Part Number (SKU) |
APL-FD
|
Manufacturer |
|
| Physical and Mechanical | |
Weight |
1.0 kg
|
| Other | |
Warranty |
|
Country of Origin |
|
HS Code Customs Tariff code
|
|
EAN |
5055383601899
|
Frequently Asked Questions
Have a Question?
-
What accessories and support are included with the Active-Plus Debugger from Debug Store?
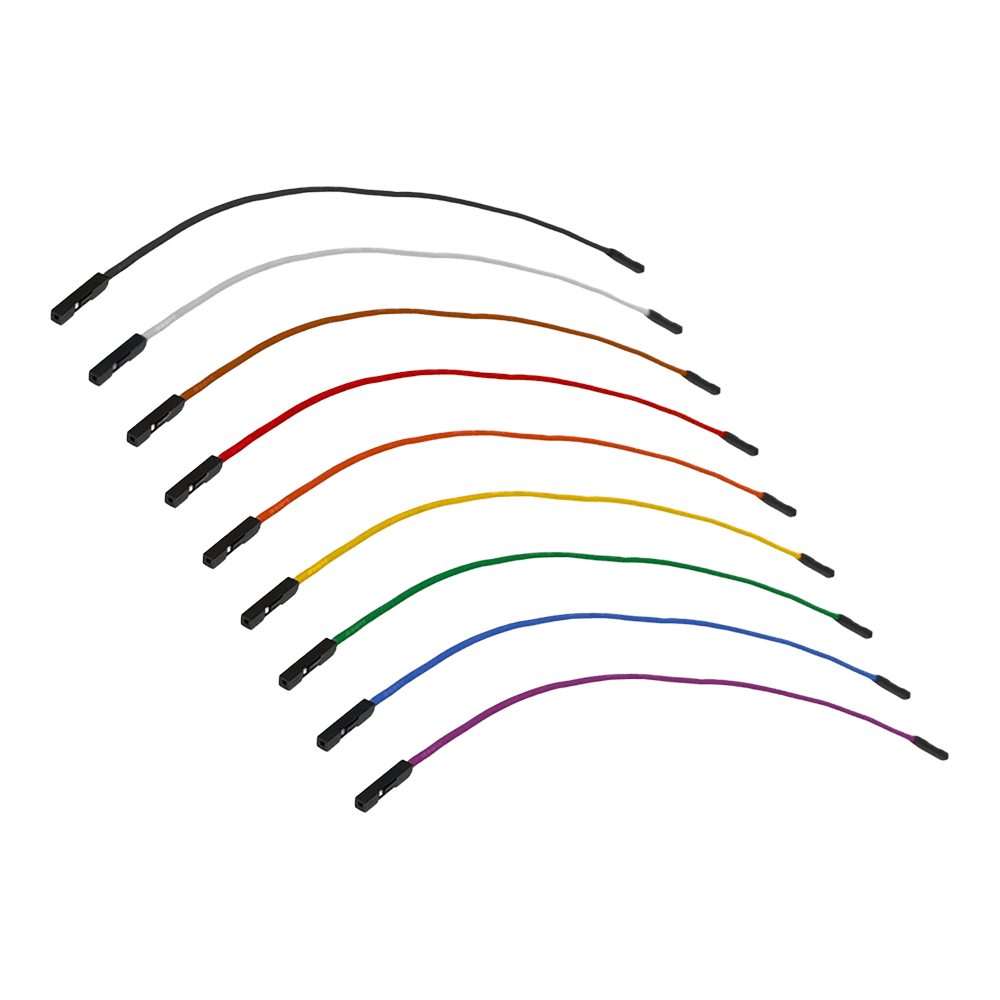
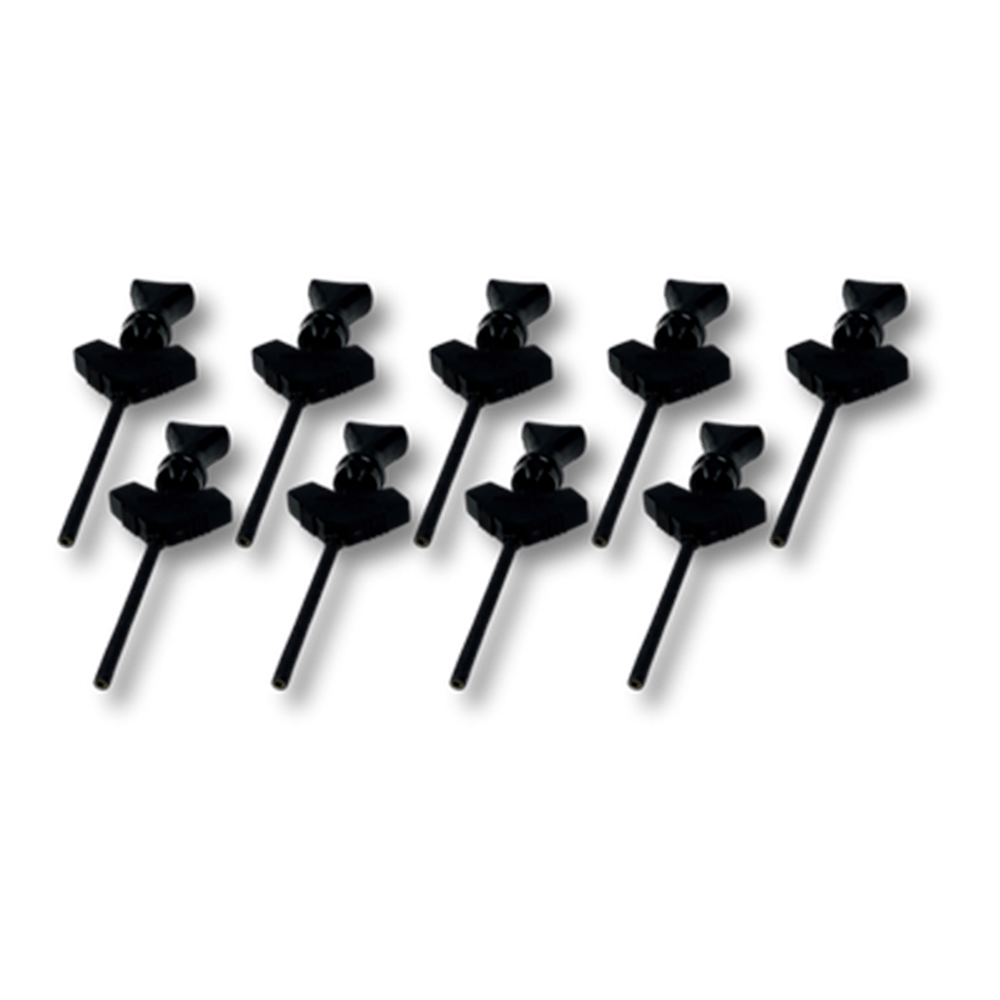
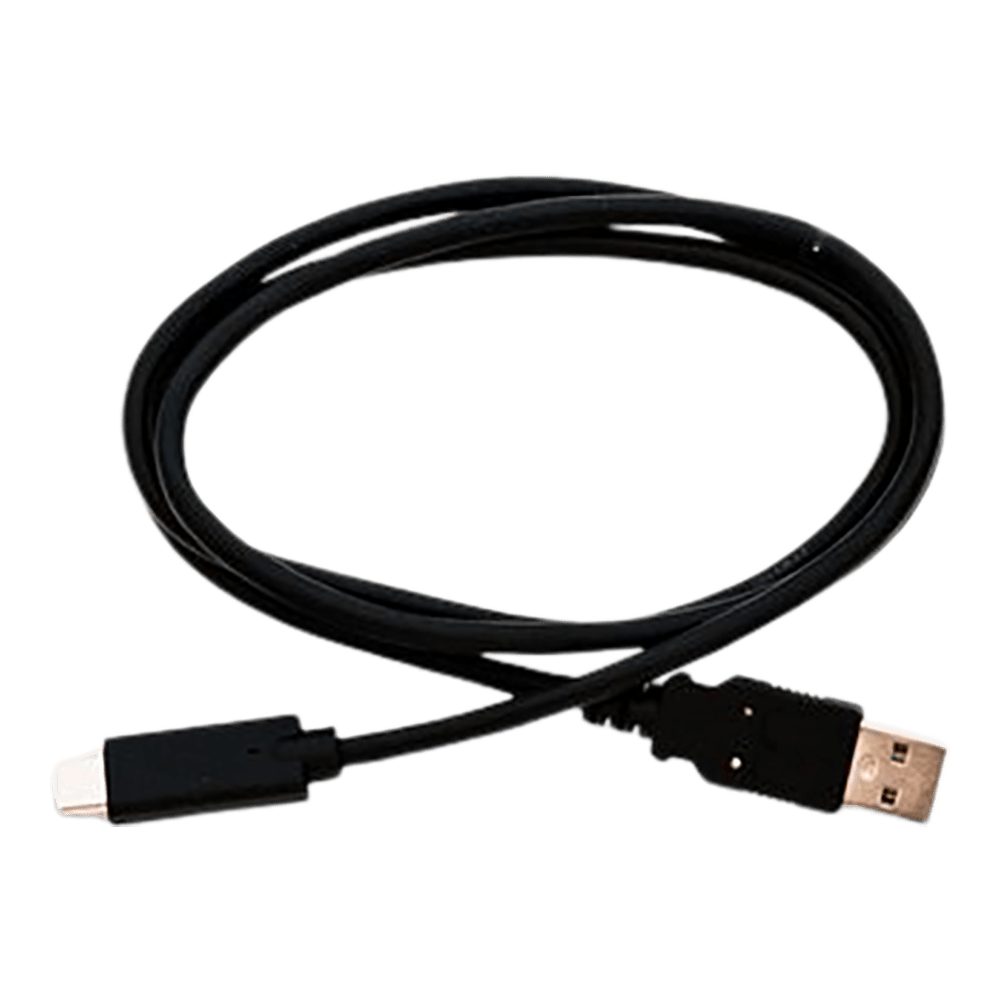
The Active-Plus Debugger from Debug Store includes a comprehensive accessory package designed for immediate deployment. The kit contains colour-coded test leads and clips for easy signal identification, a USB-C connection cable for power and data transfer, and a compact storage case for portability. Debug Store provides expert technical support and comprehensive documentation to ensure successful implementation. The device includes upgradeable firmware and software to ensure future compatibility with evolving protocols and features, representing a future-proof investment in debugging capability that maintains relevance as embedded systems technology advances.
-
How does the Active-Plus Debugger's current measurement capability enhance power analysis?
The Active-Plus Debugger incorporates dynamic current measurement capabilities that provide real-time correlation between firmware execution and power consumption patterns. Using differential input channels with appropriate shunt resistors, engineers can visualise current waveforms synchronised with firmware events and communication activities. This capability enables precise identification of power-hungry code sections, verification of power management implementations, and optimisation of battery life in portable devices. The ability to correlate current consumption with specific firmware functions provides insights unavailable from standalone current probes or power analysers that lack firmware context.
-
What software platforms and operating systems support the Active-Plus Debugger?
The Active-Plus Debugger provides cross-platform compatibility with comprehensive software support for Windows, macOS, and Linux operating systems. The accompanying software application offers an intuitive interface for capture configuration, real-time data visualisation, and analysis tools. The platform includes data export capabilities in multiple formats, enabling integration with other analysis tools like Excel or MATLAB. The software features automated setup procedures that reduce configuration complexity, allowing engineers to begin debugging quickly without extensive setup procedures that plague many traditional debugging tools.
-
Can the Active-Plus Debugger monitor multiple processors or systems simultaneously?
Yes, The Active-Plus Debugger architecture supports sophisticated multi-processor debugging scenarios, with the higher-end Active-Pro version capable of monitoring up to four separate devices simultaneously. This capability enables engineers to observe interactions between different microcontrollers, FPGAs, or mixed-signal systems on a single synchronised timeline. Each monitored device can output its own debug channels and variables, allowing comprehensive system-level debugging of complex distributed architectures. This multi-processor capability is particularly valuable for debugging communication protocols, system timing interactions, and distributed control systems where understanding the interplay between multiple processing elements is crucial.
-
How does the Active-Plus Debugger compare to premium solutions like high-end oscilloscopes and logic analysers?
The Active-Plus Debugger offers unique advantages over expensive premium solutions by combining multiple instrument functions into a single, compact device. Unlike high-end oscilloscopes that can cost thousands of pounds and only provide signal analysis, the Active-Plus delivers firmware-aware debugging that shows the causal relationship between code execution and hardware behaviour. Compared to premium logic analysers from manufacturers like Keysight or Tektronix, the Active-Plus provides superior firmware insight capabilities that these traditional instruments cannot match, as they only capture signal edges without understanding the firmware context driving those signals. The Debug Store's Active-Plus represents exceptional value by eliminating the need for multiple expensive instruments whilst providing capabilities unavailable in any single premium tool.
-
What are the sampling rates and memory depth capabilities of the Active-Plus Debugger?
the Active-Pro series demonstrates the platform's capabilities with 120 Msps digital sampling rates and virtually unlimited memory depth through streaming to disk. The advanced compression algorithms enable extended capture periods—for example, capturing 1MHz I2C transactions every 10 milliseconds can record for over 4 days per gigabyte of storage. This extensive memory depth ensures engineers can capture intermittent bugs and long-term system behaviour that would be impossible with traditional logic analysers limited by internal buffer sizes.
-
How does the Active-Plus Debugger handle real-time variable monitoring and visualisation?
The Active-Plus Debugger excels at real-time variable monitoring through its innovative Active Debug Port technology. Engineers can monitor up to 64 distinct firmware variables simultaneously per device, with automatic graphing capabilities that visualise variable changes dynamically over time. The system provides nanosecond timestamp resolution (8.3ns) for precise timing correlation between firmware events and hardware signals. This real-time visualisation allows immediate identification of firmware behaviour patterns, state transitions, and variable interactions without the need to halt code execution or insert breakpoints that alter system timing.
-
What protocols can the Active-Plus Debugger decode and analyse?
The Active-Plus Debugger features comprehensive protocol decoding capabilities for common embedded communication protocols. It automatically detects and decodes UART, SPI, and I2C communications with intelligent signal detection that eliminates manual configuration requirements. The device provides hardware-accelerated decoding at 240 Msps internal sample rate, ensuring accurate capture of high-speed protocol transactions. Advanced features include the Packet Presenter system, which automatically decodes packet fields and presents data in human-readable formats, significantly reducing analysis time compared to traditional logic analysers that only show raw signal timing.
-
Which microcontrollers and development environments are compatible with the Active-Plus Debugger?
The Active-Plus Debugger offers extensive compatibility with various microcontroller architectures including ARM Cortex-M, RISC-V, and Xtensa processors. It seamlessly integrates with popular Integrated Development Environments (IDEs) without requiring specific hardware debug ports or special configurations. The device supports any processor or FPGA through its universal active debug interface, making it IDE-agnostic and suitable for diverse development workflows. Whether you're using Arduino IDE, PlatformIO, or professional embedded development environments, the Active-Plus can be integrated by simply including a lightweight code snippet into your firmware project.
-
What is the Active-Plus Debugger and how does it differ from traditional debugging tools?
The Active-Plus Debugger is an innovative all-in-one embedded systems debugging tool that combines real-time firmware debugging capabilities with logic analyser functionality. Unlike traditional JTAG debuggers that halt code execution for debugging, the Active-Plus allows firmware to continue running whilst streaming debug data in real-time. It integrates active debug interface technology, enabling engineers to output debug messages, variables, and state information directly from firmware using simple printf statements, all whilst maintaining nanosecond timestamp accuracy. This revolutionary approach provides complete visibility into both hardware signals and firmware behaviour simultaneously on a single timeline.