
SEGGER Microcontroller GmbH
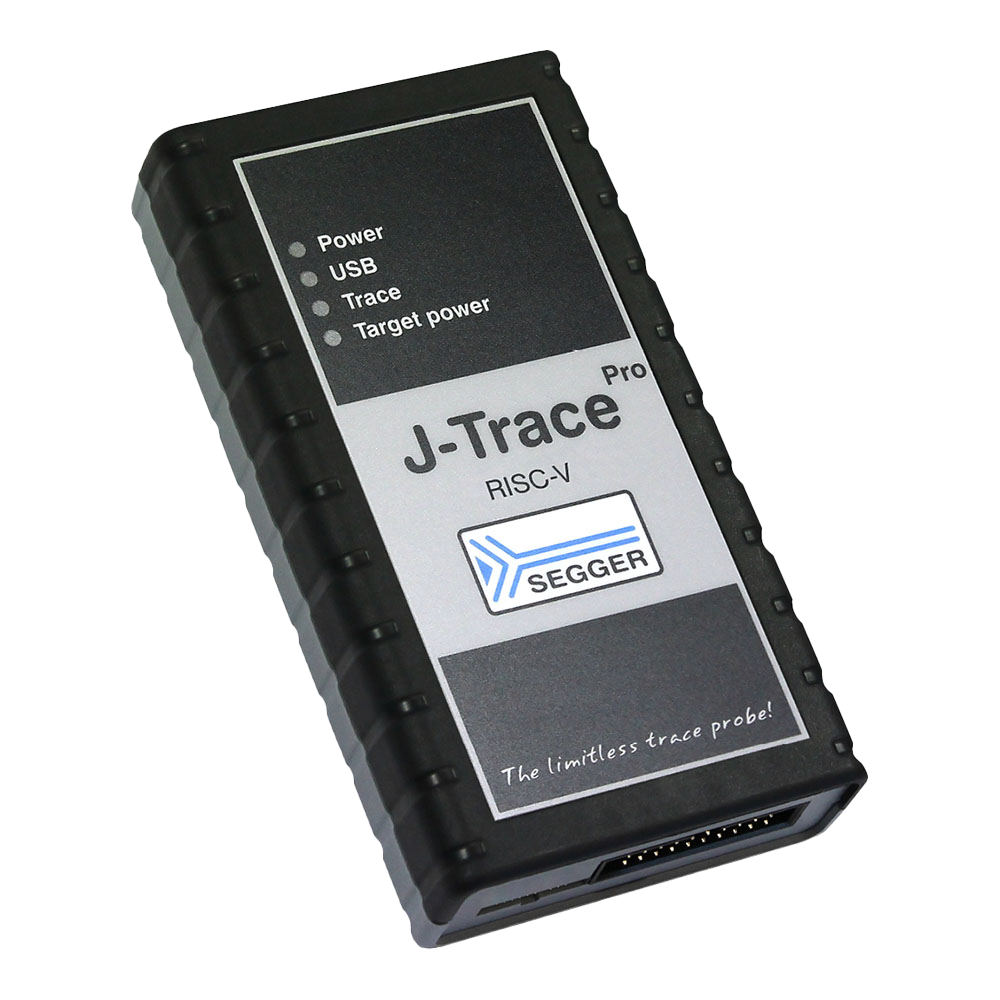
SEGGER J-Trace PRO Trace Probe
SEGGER J-Trace PRO Trace Probe
SKU: 8.24.00
Verfügbarkeit für Abholungen konnte nicht geladen werden
Key Features
Overview
The SEGGER J-Trace PRO is a leading streaming trace probe designed for embedded development professionals who require comprehensive tracing and real-time debug information. Suitable for a wide range of architectures—including Arm Cortex-M, Cortex-A/R, RISC-V, Microchip PIC32, Renesas RX, and more—the J-Trace PRO combines all the robust debugging capabilities of the renowned J-Link with advanced features such as unlimited streaming trace, live code coverage, and code profiling. This makes it possible to record hard-to-reproduce bugs occurring over extended periods, enabling engineers to isolate software defects efficiently and meet regulatory documentation requirements.
The J-Trace PRO series includes models designed specifically for Cortex-M, Cortex-A/R/M, and RISC-V microcontrollers. Each variant offers seamless integration with popular IDEs and SEGGER’s Ozone debugger for real-time performance analysis, all delivered via SuperSpeed USB 3.0 or Gigabit Ethernet interfaces. Unlike conventional trace probes restricted by internal buffer sizes, J-Trace PRO enables continuous trace output—making it a compelling choice for teams working on complex, safety-critical, or time-sensitive embedded systems. Consider J-Trace PRO for its broad device support, top-tier performance, and commitment to future-proof debugging in modern development environments.
Downloads
Questions and Answers
-
What Are the Connectivity Advantages of Dual USB 3.0 and Ethernet Interfaces?
SuperSpeed USB 3.0 gives download speeds up to 4MB/s for fast development cycles. Gigabit Ethernet allows remote debugging over networks and integration into test farms, which helps with systems in inaccessible locations or automated test setups.
-
Can the J-Trace PRO Debug Multiple Processor Cores Simultaneously?
Yes. Multiple debugger instances can share the same physical connection, with each core accessed through the JTAG scan chain configuration. This lets you debug different cores on the same target at the same time, including multi-core and heterogeneous processing architectures.
-
What Trace Memory Capacity Does the J-Trace PRO Provide, and Why Is This Significant?
The J-Trace PRO has a 64MB on-board trace buffer plus unlimited streaming. Streaming allows continuous capture over unlimited periods, so it suits both short debugging sessions and long-term system analysis.
-
How Does the Ozone Debugger Enhance the J-Trace PRO's Capabilities?
Ozone is SEGGER's debugger for visualising J-Trace PRO trace data. It provides:
- Timeline views, execution counters and code coverage displays
- Real-time trace analysis with live updating counters
- Function profiling and instruction tracing
- Performance analysis
- Automated report generation for verification
-
What Makes the J-Trace PRO Different From Standard Debugging Probes?
The J-Trace PRO combines all J-Link debugging capabilities with streaming trace in one unit. Conventional probes capture limited trace data to internal buffers, whereas the J-Trace PRO provides unlimited streaming trace with real-time analysis, giving visibility over long runs up to the fault. This makes it effective for capturing intermittent bugs that occur infrequently over long periods.
-
Which Processor Architectures Does the J-Trace PRO Support?
The J-Trace PRO supports ARM Cortex-M, Cortex-A, Cortex-R and RISC-V processors. Debug Store also stocks variants optimised for specific architectures.
-
How Does Unlimited Streaming Trace Benefit Embedded Developers?
Unlimited streaming trace captures complete instruction traces with no internal buffer limit on recording time. You can record hard-to-reproduce bugs that appear over hours or days and see exactly what happened when a program "runs off the rails". Streaming runs at the full trace clock, up to 150 MHz (TPIU frequency up to 300 MHz).
-
What Is Live Code Profiling and How Does It Improve Development Efficiency?
Live Code Profiling shows in real time which instructions have executed and how often, so you can find performance hotspots and optimisation opportunities while the system runs. It's non-intrusive, using ARM's Embedded Trace Macrocell (ETM) without code instrumentation, so it suits hard real-time systems where you can't modify the code.
-
How Does the J-Trace PRO's Code Coverage Functionality Assist with Regulatory Compliance?
The J-Trace PRO provides instruction-level code coverage that is non-intrusive and doesn't alter code execution. This gives verifiable evidence of which code sections ran during testing, which helps meet regulatory requirements. Coverage reports can be exported for documentation and certification, for example on safety-critical applications.
No questions match your search.