


SEGGER Microcontroller GmbH
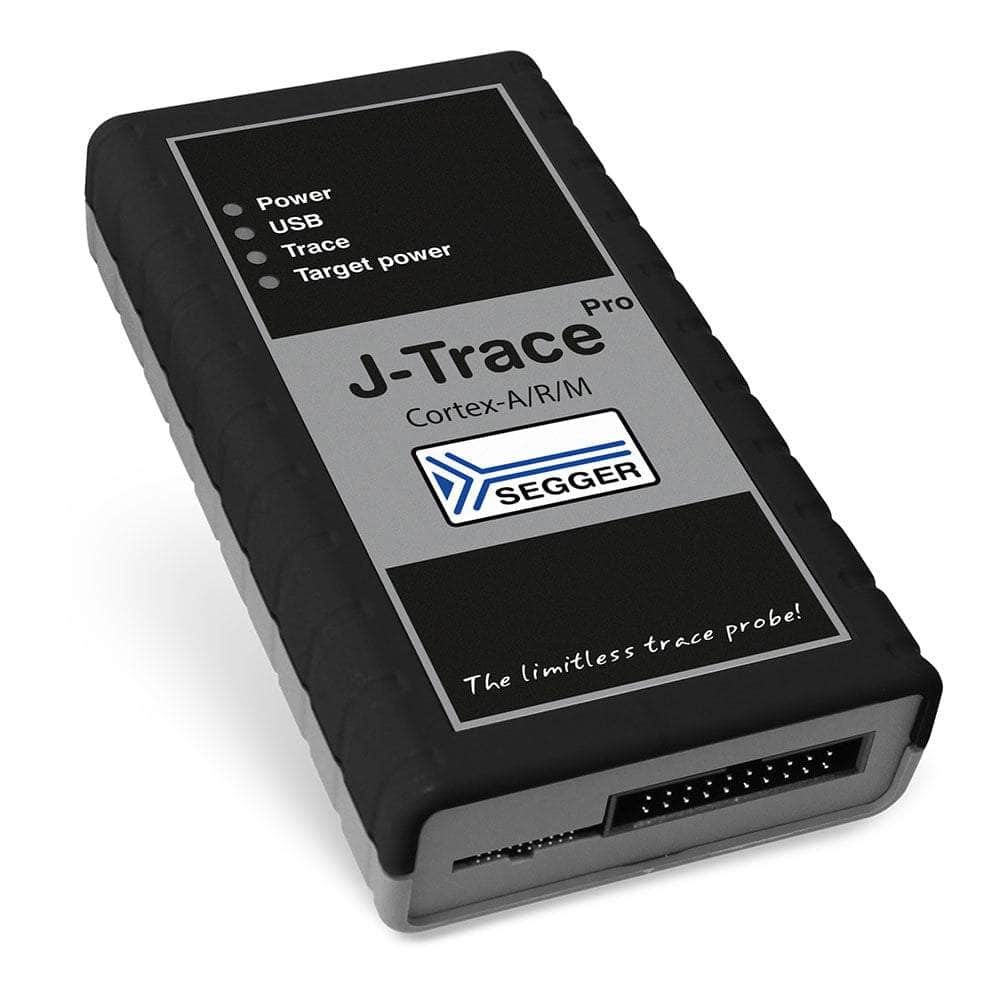
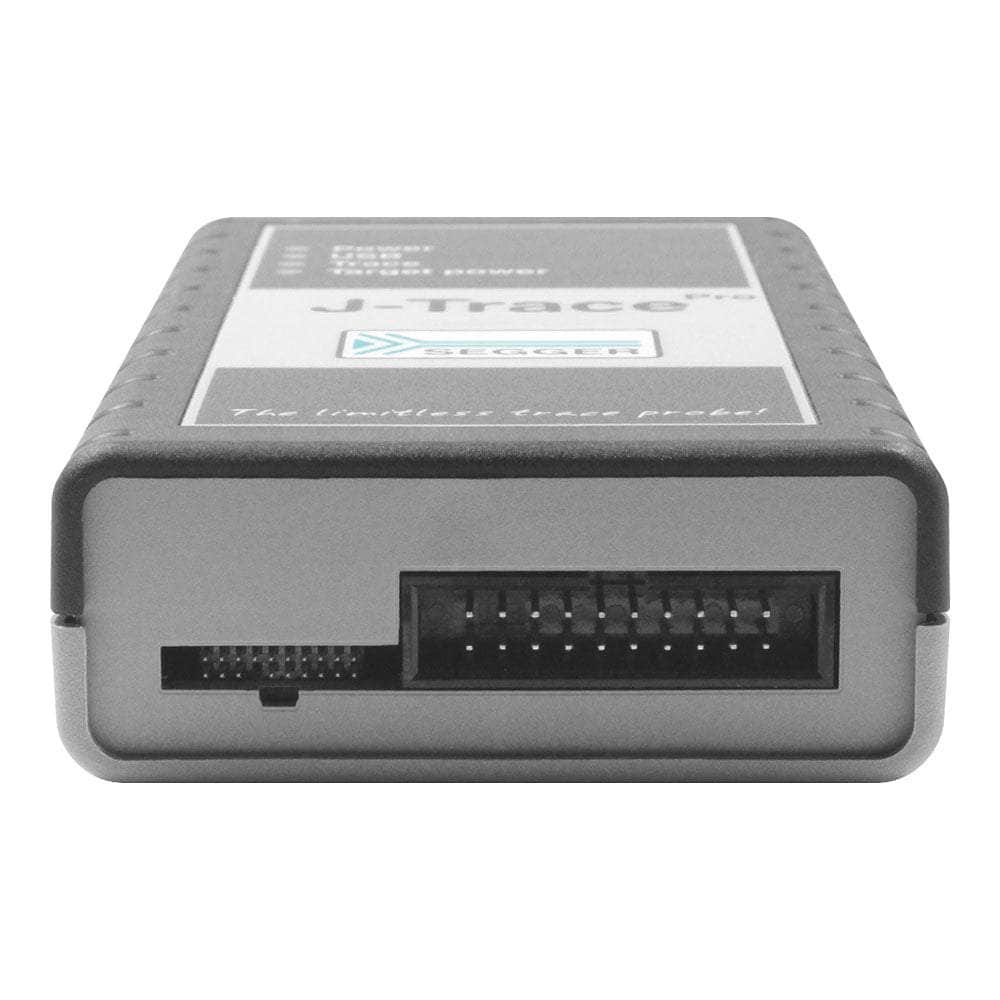
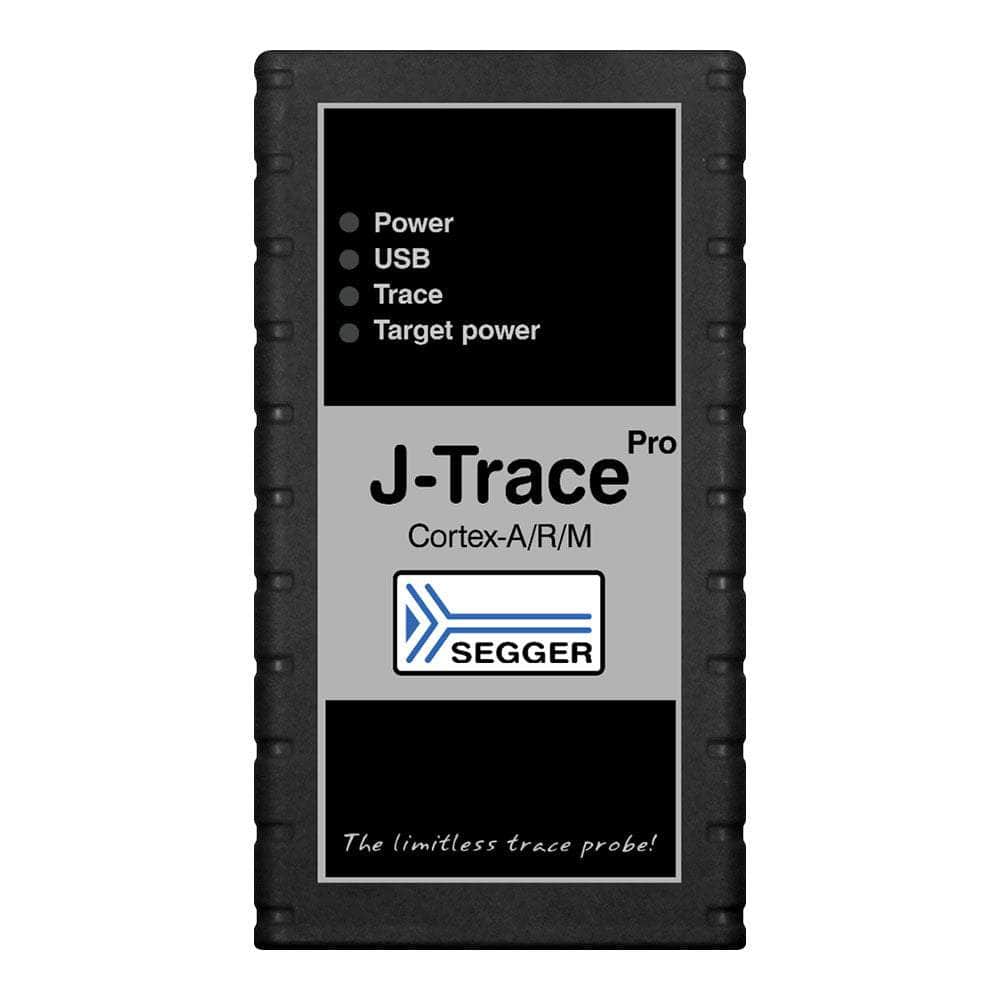
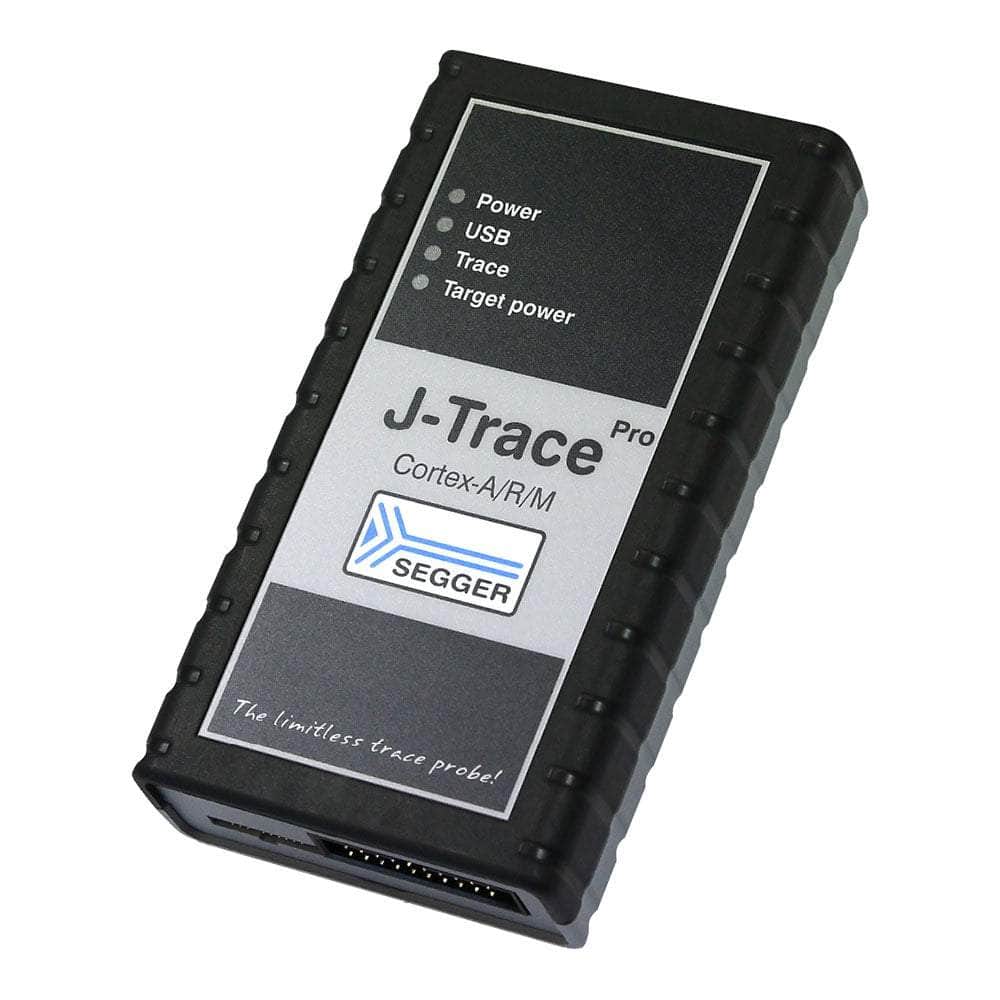
SEGGER J-Trace PRO Cortex Trace Debugger
SEGGER J-Trace PRO Cortex Trace Debugger
SKU: 8.20.00
Verfügbarkeit für Abholungen konnte nicht geladen werden


Key Features
Overview
Unleash the Power of SuperSpeed Trace Probe for Cortex-A/R/M Microcontrollers
Upgrade your development experience with the J-Trace PRO Cortex, the cutting-edge trace probe designed to provide unparalleled support for Cortex-A/R/M-based microcontrollers. Unlock the full potential of your projects and optimize your code like never before!
Continuous Streaming Trace with USB 3.0 Interface
Say goodbye to data transmission bottlenecks! J-Trace PRO Cortex boasts a superspeed USB 3.0 interface that enables seamless continuous streaming trace via USB, with full trace clock support. This means no more limitations from internal buffers and a faster data transmission rate, empowering developers with critical insights to fine-tune their applications.
Capture Complete Traces Over Extended Periods
Don't let elusive bugs slow you down! With J-Trace PRO, you can capture complete traces over long periods, allowing you to record infrequent and hard-to-reproduce bugs. This feature is particularly helpful when the program flow derails and stops in a fault state, giving you the tools to diagnose and resolve issues quickly.
SuperSpeed USB 3.0 Driven Debug Probe with 64 MB On-Board Trace BufferExperience lightning-fast download speeds with the J-Trace PRO Cortex. With up to 4.0 MB/s download speed and a generous 64 MB onboard trace buffer, you can work efficiently without any compromises.
Unmatched Features for Unparalleled Performance
The J-Trace PRO Cortex is not just a trace probe; it's a comprehensive solution for your development needs. It comes loaded with an array of powerful features:
Real-time streaming at full System Clock for instant feedback on your application's performance. Live profiling to fine-tune your application for optimal execution.
Instruction-level code coverage to meet regulatory requirements and gain visibility into executed code segments. Unlimited trace support for isolating and identifying hard-to-find code defects.
Supports a Wide Range of Targets
The J-Trace PRO Cortex supports Cortex-A, Cortex-R, and Cortex-M targets, providing versatility for your development projects. Whether you're working on a complex application for high-performance Cortex-A processors or embedded systems with Cortex-M cores, this trace probe has covered you.
Full J-Link Debug Functionality
In addition to its trace capabilities, the J-Trace PRO Cortex retains full J-Link debug functionality. You can enjoy the benefits of a powerful debug probe alongside exceptional trace capabilities, making it a true all-in-one solution for your development needs.
Further Advantages - Unlock the Full Potential
Take your development process to the next level with J-Trace PRO Cortex's extended trace features:
Code Coverage Analysis
Gain visibility over which parts of your application code have been executed, enabling you to verify test completeness and identify untested areas.
Execution Profiling
Understand which instructions are executed and how often, allowing you to identify performance bottlenecks and optimization opportunities.
Take advantage of the opportunity to supercharge your development workflow. Get the J-Trace PRO Cortex now and revolutionize how you optimize and debug your projects!
Downloads
Entfesseln Sie die Leistung der SuperSpeed Trace Probe für Cortex-A/R/M-Mikrocontroller
Verbessern Sie Ihre Entwicklungserfahrung mit J-Trace PRO Cortex, der hochmodernen Trace-Sonde, die beispiellose Unterstützung für Cortex-A/R/M-basierte Mikrocontroller bietet. Schöpfen Sie das volle Potenzial Ihrer Projekte aus und optimieren Sie Ihren Code wie nie zuvor!
Kontinuierlicher Streaming-Trace mit USB 3.0-Schnittstelle
Verabschieden Sie sich von Engpässen bei der Datenübertragung! J-Trace PRO Cortex verfügt über eine superschnelle USB 3.0-Schnittstelle, die nahtloses kontinuierliches Streaming-Trace über USB mit voller Trace-Clock-Unterstützung ermöglicht. Das bedeutet keine Einschränkungen mehr durch interne Puffer und eine schnellere Datenübertragungsrate, wodurch Entwickler wichtige Erkenntnisse zur Feinabstimmung ihrer Anwendungen erhalten.
Erfassen Sie vollständige Spuren über längere Zeiträume
Lassen Sie sich nicht durch schwer zu findende Bugs ausbremsen! Mit J-Trace PRO können Sie über lange Zeiträume hinweg vollständige Traces erfassen und so auch seltene und schwer reproduzierbare Bugs aufzeichnen. Diese Funktion ist besonders hilfreich, wenn der Programmfluss entgleist und in einem Fehlerzustand stoppt, da sie Ihnen die Werkzeuge zur schnellen Diagnose und Lösung von Problemen bietet.
SuperSpeed USB 3.0-gesteuerte Debug-Sonde mit 64 MB On-Board-Trace-BufferErleben Sie blitzschnelle Downloadgeschwindigkeiten mit dem J-Trace PRO Cortex. Mit bis zu 4,0 MB/s Downloadgeschwindigkeit und einem großzügigen 64 MB Onboard-Trace-Puffer können Sie effizient und ohne Kompromisse arbeiten.
Unübertroffene Funktionen für beispiellose Leistung
Der J-Trace PRO Cortex ist nicht nur eine Trace-Sonde, sondern eine umfassende Lösung für Ihre Entwicklungsanforderungen. Er ist mit einer Reihe leistungsstarker Funktionen ausgestattet:
Echtzeit-Streaming bei voller Systemuhr für sofortiges Feedback zur Leistung Ihrer Anwendung. Live-Profiling zur Feinabstimmung Ihrer Anwendung für eine optimale Ausführung.
Codeabdeckung auf Befehlsebene, um gesetzliche Anforderungen zu erfüllen und Einblick in ausgeführte Codesegmente zu erhalten. Unbegrenzte Ablaufverfolgungsunterstützung zum Isolieren und Identifizieren schwer zu findender Codefehler.
Unterstützt eine breite Palette von Zielen
Der J-Trace PRO Cortex unterstützt Cortex-A-, Cortex-R- und Cortex-M-Ziele und bietet Vielseitigkeit für Ihre Entwicklungsprojekte. Egal, ob Sie an einer komplexen Anwendung für leistungsstarke Cortex-A-Prozessoren oder eingebettete Systeme mit Cortex-M-Kernen arbeiten, diese Trace-Sonde ist für Sie da.
Vollständige J-Link-Debug-Funktionalität
Zusätzlich zu seinen Trace-Funktionen verfügt der J-Trace PRO Cortex über die vollständige J-Link-Debugfunktionalität. Sie profitieren von den Vorteilen einer leistungsstarken Debugsonde und außergewöhnlichen Trace-Funktionen, was ihn zu einer echten Komplettlösung für Ihre Entwicklungsanforderungen macht.
Weitere Vorteile - Schöpfen Sie das volle Potenzial
Bringen Sie Ihren Entwicklungsprozess mit den erweiterten Trace-Funktionen von J-Trace PRO Cortex auf die nächste Ebene:
Code Coverage Analyse
Erhalten Sie Einblick in die Teile Ihres Anwendungscodes, die ausgeführt wurden. So können Sie die Vollständigkeit des Tests überprüfen und ungetestete Bereiche identifizieren.
Ausführungsprofilierung
Informieren Sie sich darüber, welche Anweisungen wie oft ausgeführt werden. So können Sie Leistungsengpässe und Optimierungsmöglichkeiten erkennen.
Nutzen Sie die Gelegenheit, Ihren Entwicklungsworkflow zu optimieren. Holen Sie sich jetzt den J-Trace PRO Cortex und revolutionieren Sie die Art und Weise, wie Sie Ihre Projekte optimieren und debuggen!
| General Information | |
|---|---|
Part Number (SKU) |
8.20.00
|
Manufacturer |
|
| Physical and Mechanical | |
Weight |
1.0 kg
|
| Other | |
EAN |
5055383619535
|
Frequently Asked Questions
Have a Question?
-
What are the power and connectivity specifications for the J-Trace PRO Cortex?
The J-Trace PRO Cortex operates as a USB-powered device requiring maximum 400mA, eliminating the need for external power supplies in most configurations. The target interface supports voltage levels from 1.2V to 5V, accommodating both modern low-voltage and legacy embedded systems. Maximum trace clock frequency reaches 150MHz, supporting even the fastest Cortex implementations. The device features robust electrical specifications with controlled rise/fall times for optimal signal integrity: data input rise/fall times of maximum 20ns, and clock rise/fall times of maximum 10ns. Physical dimensions are compact at 123mm × 68mm × 30mm with a weight of just 120g without cables, making it highly portable for field debugging applications. Operating temperature range spans +5°C to +60°C with storage capability from -20°C to +65°C. The J-Trace PRO Cortex meets stringent electromagnetic compatibility standards (EN 55022, EN 55024), ensuring reliable operation in professional development environments without interference issues.
-
Which Cortex architectures and devices does the J-Trace PRO Cortex support?
The J-Trace PRO Cortex provides comprehensive support for Cortex-A, Cortex-R, and Cortex-M architectures, making it a versatile solution for diverse embedded projects. Supported Cortex-M cores include M0, M0+, M1, M3, M4, M7, M23, and M33 variants. Cortex-A support encompasses A5, A7, A8, A9, A12, A15, and A17 processors. Cortex-R support includes R4 and R5 cores. The extensive tested devices list includes major manufacturers such as STMicroelectronics, NXP, Infineon, Atmel, AmbiqMicro, and many others. SEGGER continuously expands device support through regular software updates, often requiring only firmware updates for new device compatibility. The J-Trace PRO Cortex specifically targets the broadest range of ARM Cortex implementations, making it ideal for development teams working across multiple projects with different processor architectures. This extensive compatibility, combined with SEGGER's proven track record of rapid new device support, ensures long-term investment protection for professional development teams.
-
What software tools are included with the J-Trace PRO Cortex?
The J-Trace PRO Cortex includes SEGGER's comprehensive professional software suite at no additional cost. The package comprises Ozone, SEGGER's full-featured graphical debugger and performance analyser, providing advanced trace visualisation, code profiling, and coverage analysis capabilities. J-Flash and J-Flash SPI enable high-speed flash programming for both internal and external memory devices. The complete J-Link Software and Documentation Package provides multi-platform support (Windows, macOS, Linux) with regular free updates. All software integrates seamlessly with popular IDEs including Keil, IAR, Embedded Studio, Eclipse, and others through standard debugging interfaces. The Ozone debugger stands out as a particularly powerful standalone tool, offering real-time trace analysis, instruction-level debugging, and comprehensive performance profiling without requiring additional licences or complex setup procedures. This complete software ecosystem significantly reduces total cost of ownership compared to competitors requiring separate software purchases.
-
How does Unlimited Flash Breakpoints work in the J-Trace PRO Cortex?
The J-Trace PRO Cortex includes SEGGER's industry-leading Unlimited Flash Breakpoints feature, allowing developers to set unlimited breakpoints even when debugging applications located in flash memory. This technology automatically uses hardware breakpoints when available (typically 2-6 on Cortex devices), then seamlessly transitions to software breakpoints in flash when hardware breakpoints are exhausted. The system employs sophisticated optimisations including instruction set simulation, flash caching, and intelligent sector reprogramming to minimise flash write cycles. Performance is optimised to such a degree that developers won't notice when they've exceeded hardware breakpoint limits—debugging in flash feels virtually identical to RAM debugging. The feature works with both internal and external flash memories, including memory-mapped QSPI flash devices where hardware breakpoints cannot be used. This eliminates the traditional debugging limitation of embedded systems where applications must run from flash due to insufficient RAM capacity.
-
What interfaces does the J-Trace PRO Cortex provide and why are they advantageous?
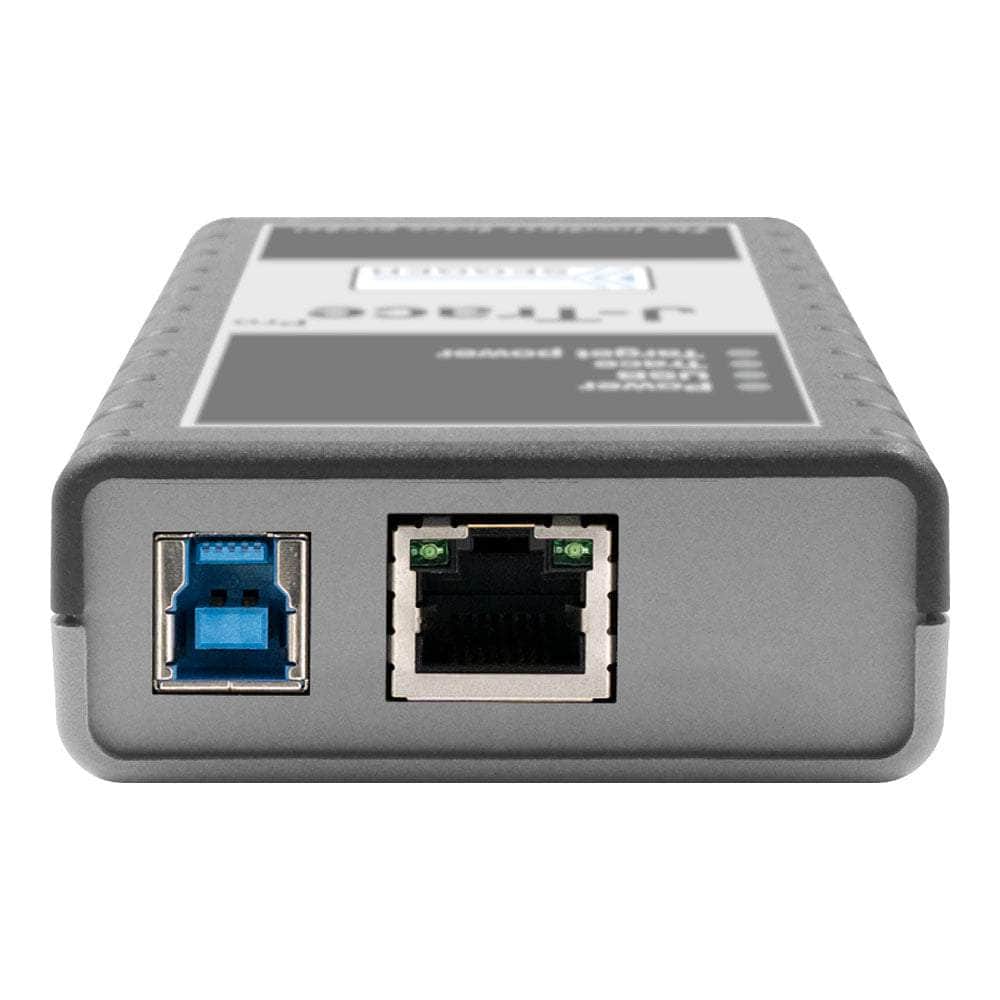
The J-Trace PRO Cortex features dual high-speed interfaces: SuperSpeed USB 3.0 and Gigabit Ethernet. The USB 3.0 interface enables continuous streaming trace at full system clock with download speeds up to 4MB/s, eliminating bottlenecks from traditional USB 2.0 connections. The Gigabit Ethernet interface allows remote debugging over networks, enabling developers to debug targets in test chambers, production environments, or geographically distributed locations. This dual-interface approach provides exceptional flexibility—USB 3.0 for maximum performance during development, and Ethernet for remote access and production debugging scenarios. Both interfaces support the full feature set including streaming trace, flash breakpoints, and real-time analysis. The J-Trace PRO also includes two target connectors: a 20-pin debug connector and a combined 19-pin debug and trace connector, providing maximum compatibility with different target configurations whilst maintaining signal integrity for high-speed trace operations.
-
Does the J-Trace PRO Cortex support multi-core debugging?
Yes, the J-Trace PRO Cortex fully supports multi-core debugging environments. Multiple debuggers or debugger instances can simultaneously use the same J-Trace PRO unit, enabling parallel debugging of different cores on multi-core target systems. The configuration process is straightforward, requiring only proper scan chain setup for each debugger instance—no special settings are needed for multi-core operation. This capability is particularly valuable for modern Cortex-A and Cortex-R processors featuring multiple cores, allowing development teams to debug complex interactions between cores efficiently. The J-Trace PRO maintains full trace functionality across all cores, providing comprehensive system-wide visibility during multi-core debugging sessions. Combined with SEGGER's proven reliability and extensive device support, this makes the J-Trace PRO Cortex an excellent choice for advanced embedded systems requiring sophisticated debugging capabilities across multiple processing cores.
-
What trace analysis features does the J-Trace PRO Cortex provide for code optimisation?
The J-Trace PRO Cortex offers comprehensive trace analysis through Live Code Profiling and Live Code Coverage capabilities. Live Code Profiling provides real-time visibility into which instructions execute and their frequency, enabling developers to identify performance hotspots and optimisation opportunities instantly. Live Code Coverage delivers instruction-level analysis showing exactly which parts of application code have been executed, essential for meeting regulatory requirements and ensuring thorough testing. The integrated Ozone debugger displays execution counters in real-time alongside source code, updating live as the application runs. Additionally, the trace system provides complete instruction-level visibility, allowing developers to verify code paths, analyse function call durations, and measure CPU load per function. All trace data can be exported for further analysis or compliance documentation, making it ideal for safety-critical applications requiring comprehensive verification.
-
Can the J-Trace PRO Cortex capture infrequent, hard-to-reproduce bugs?
Absolutely. The J-Trace PRO Cortex excels at capturing elusive bugs through its unlimited streaming trace capability. Unlike traditional debuggers limited by internal buffer sizes, the J-Trace PRO can record complete traces over extended periods—hours or even days—enabling the detection of intermittent faults that occur infrequently. This is particularly valuable when program flow "runs off the rails" and stops in a fault state, providing developers with comprehensive trace data leading up to the failure. The continuous streaming via USB 3.0 ensures no critical trace information is lost, while the 64MB on-board buffer provides additional security for data capture. This capability proves invaluable for complex embedded systems using communication stacks like Ethernet or USB, where bugs may manifest only under specific timing conditions or after prolonged operation.
-
How does the J-Trace PRO Cortex compare to higher-end competitors like Lauterbach TRACE32?
Whilst Lauterbach TRACE32 solutions command significantly higher prices and require extensive training (typically 1-2 days), the J-Trace PRO Cortex delivers comparable trace functionality at a fraction of the cost with superior ease of use. Unlike Lauterbach's complex setup requirements, the J-Trace PRO Cortex can be operational within 15 minutes using SEGGER's intuitive Ozone debugger. The J-Trace PRO offers multi-platform support (Windows, macOS, Linux), SuperSpeed USB 3.0 and Gigabit Ethernet interfaces, whilst maintaining streaming trace at full system clock with real-time analysis capabilities. Where Lauterbach excels in maximum bandwidth for the most demanding applications, the J-Trace PRO Cortex provides exceptional value for the majority of embedded development projects, offering professional-grade streaming trace with live code profiling and coverage analysis without the steep learning curve or premium pricing of enterprise solutions.
-
What is the Segger J-Trace PRO Cortex debugger and what makes it unique?
The Segger J-Trace PRO Cortex is a professional streaming trace probe designed specifically for Cortex-A/R/M-based microcontrollers. What sets it apart is its SuperSpeed USB 3.0 interface enabling continuous streaming trace with full trace clock support, coupled with a massive 64MB on-board trace buffer. This eliminates the traditional limitations of internal buffers and slow data transmission, providing unlimited streaming trace capabilities over extended periods. The J-Trace PRO Cortex uniquely combines all J-Link debug functionality with advanced trace analysis features, offering download speeds up to 4MB/s—making it one of the fastest trace probes available. Available exclusively from trusted suppliers like Debug Store, this debugger represents the pinnacle of embedded development tools for professional engineers requiring comprehensive trace analysis capabilities.