


Active Firmware Tools
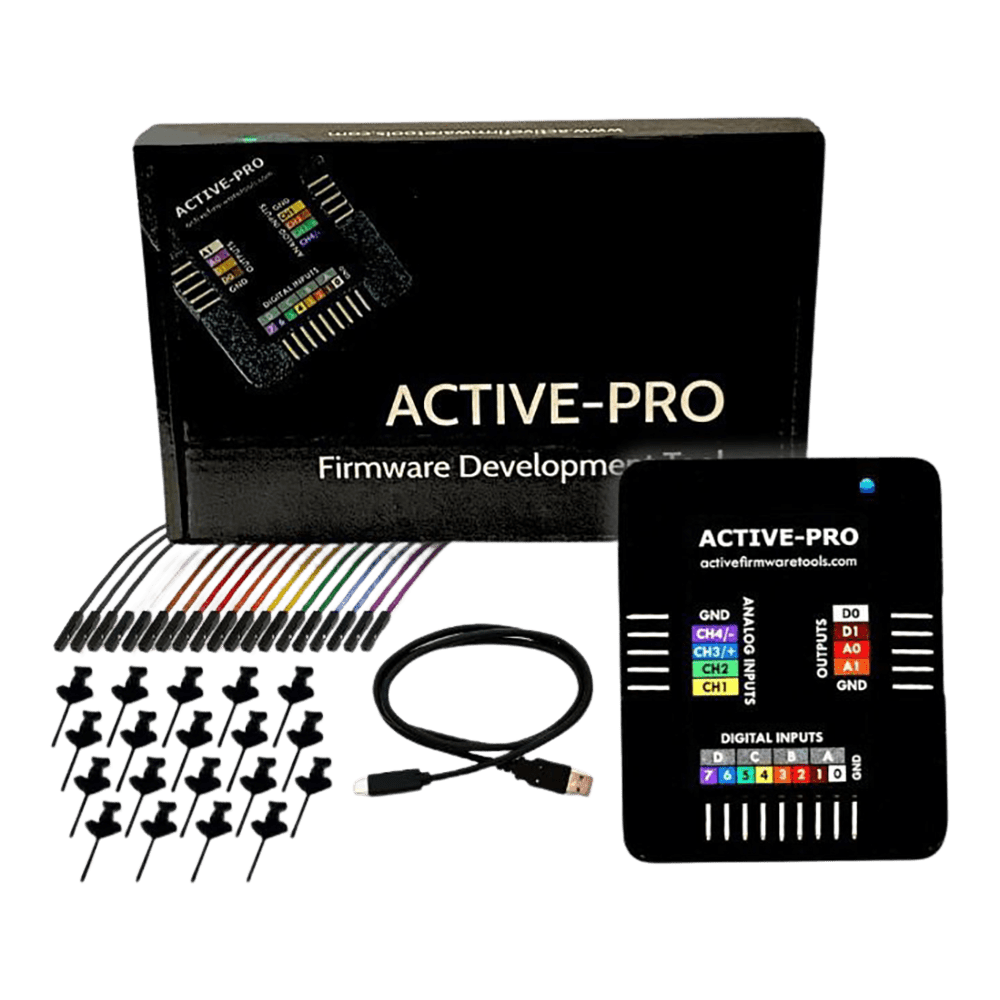
Active-Pro Firmware-Debugger
Active-Pro Firmware-Debugger
SKU: AP-FD
Verfügbarkeit für Abholungen konnte nicht geladen werden


Key Features
Overview
Say goodbye to the frustrations of debugging your embedded firmware systems with the innovative Active-Pro Firmware Debugger. This powerful tool has been designed to streamline your debugging process, allowing you to focus on what really matters – developing robust firmware solutions.
The Active-Pro Firmware Debugger offers a comprehensive debugging experience with a new, user-friendly interface that simplifies your workflow. It provides clear, concise insights into your design's operation, enabling you to spot and rectify bugs with ease and efficiency.
Key features include:
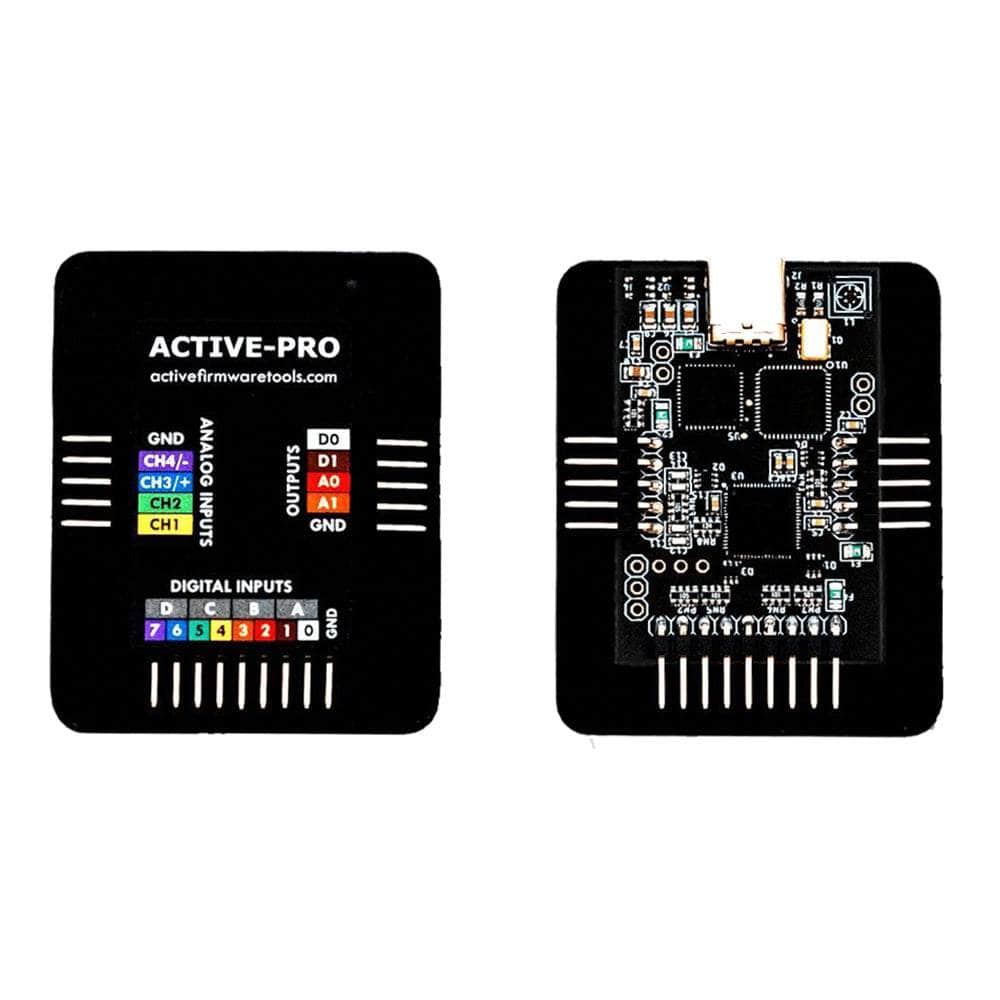
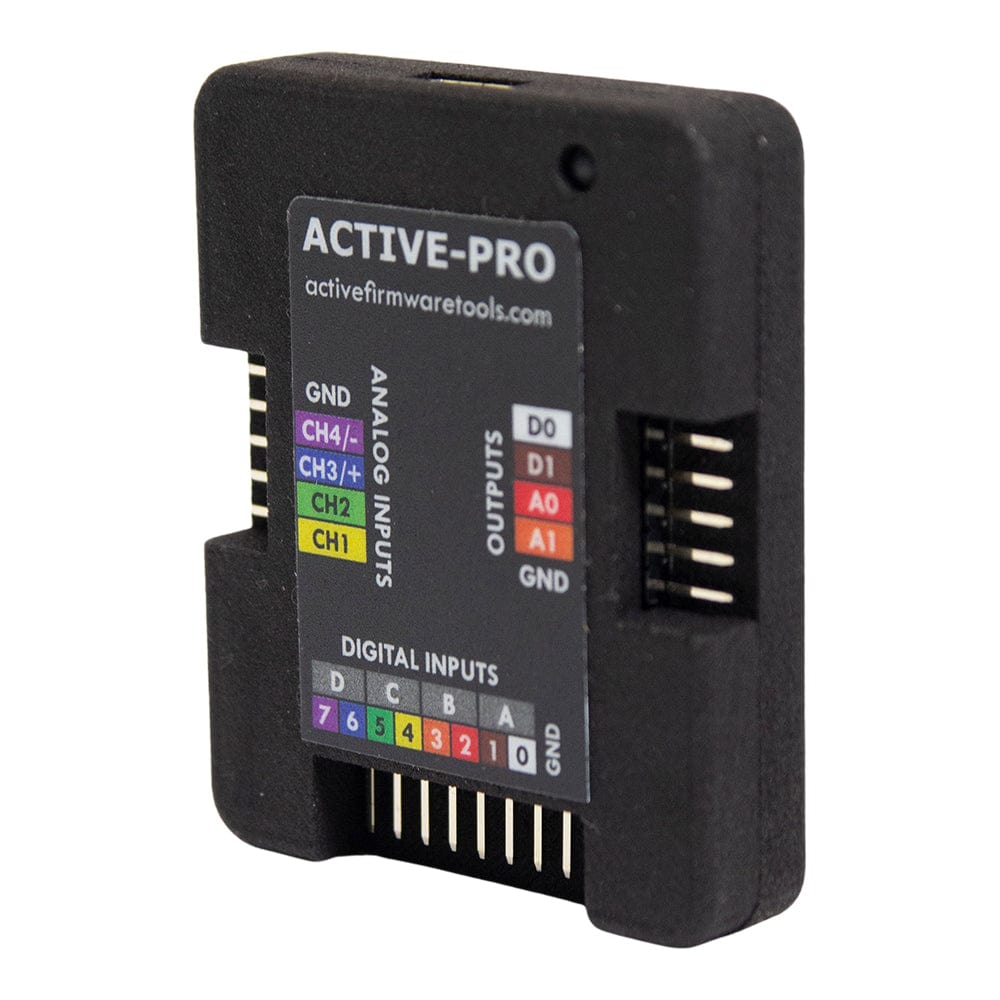
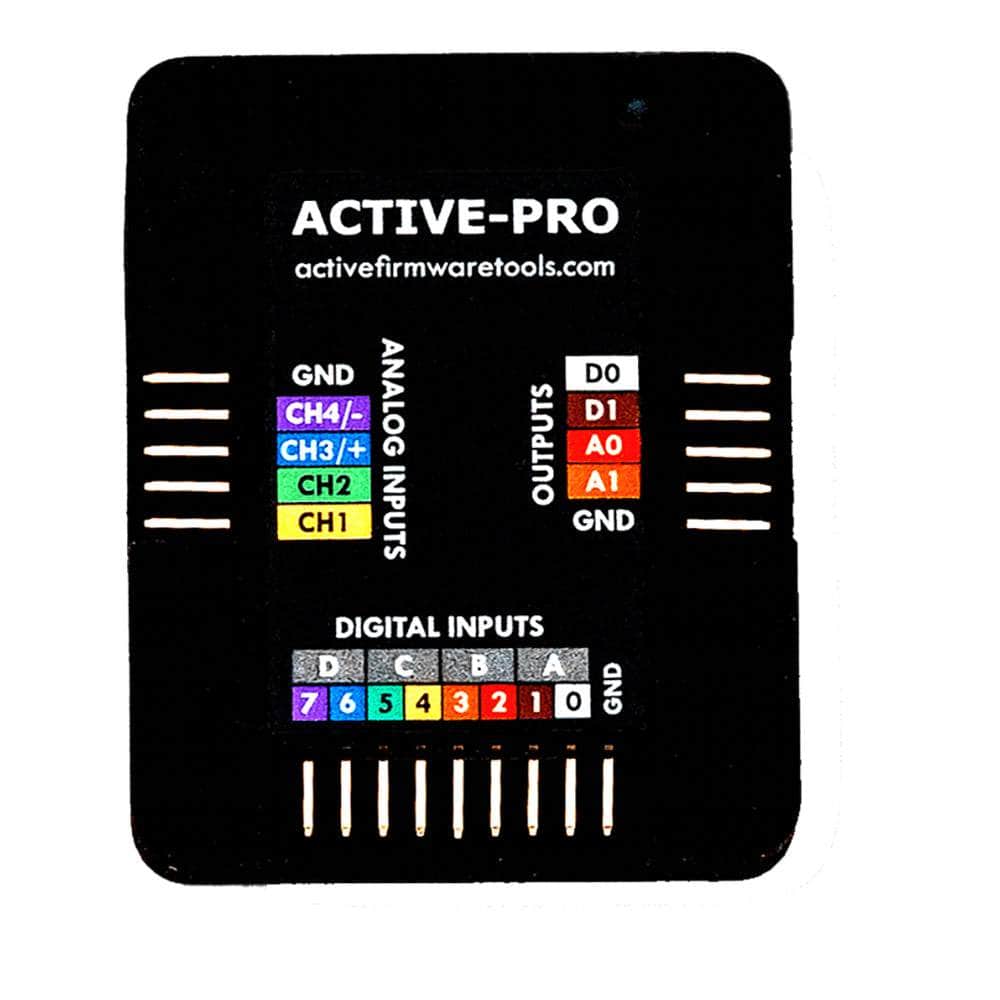
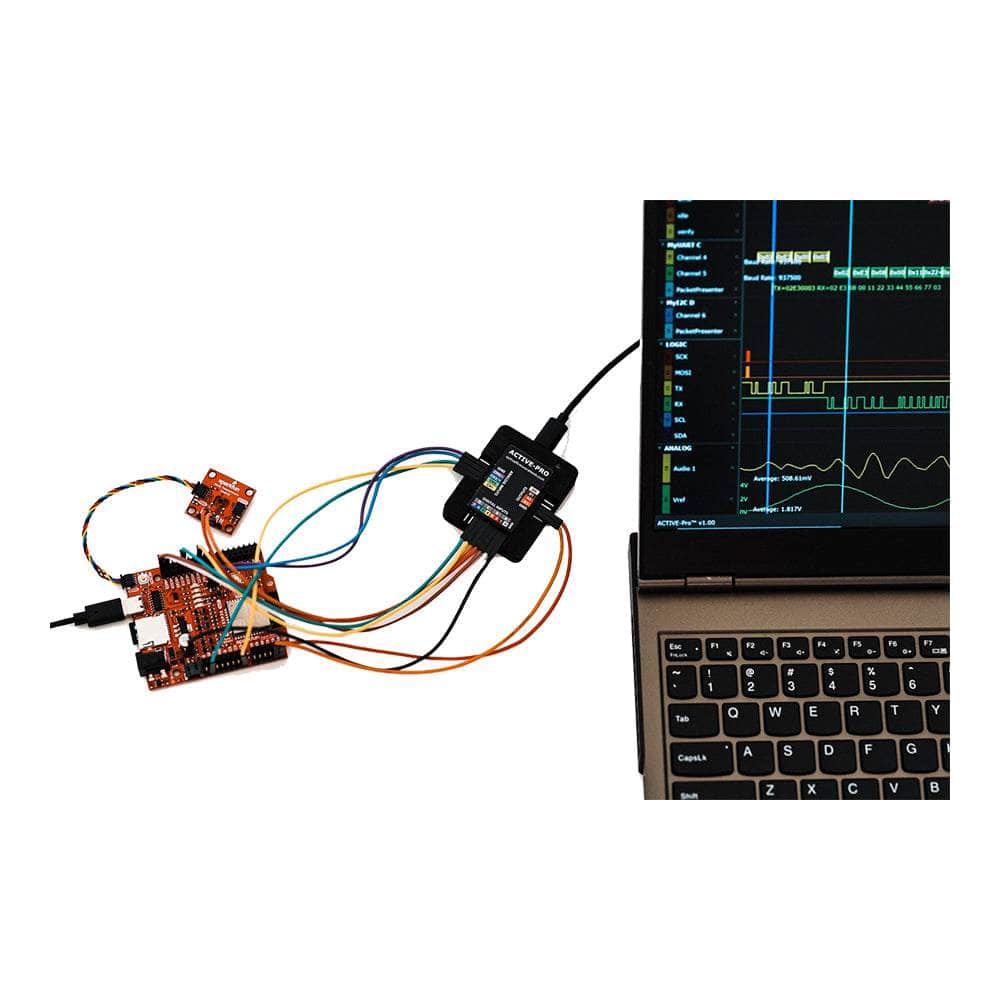
- Multi-Protocol Support: The Active-Pro captures and displays a range of data types, including Logic Analyzer digital data, Oscilloscope analogue data, and easily decodes protocols such as I2C, SPI, and UART.
- Real-Time Data Streaming: This remarkable debugger streams data directly to disk, allowing you to capture and store data for persistent bug tracking and quicker debugging sessions.
One of the standout aspects of the Active-Pro Firmware Debugger is its simple connection options. Utilising either a 1-wire (UART) or 2-wire (GPIO) interface, it works seamlessly with various programming languages such as C, C++, and Python. With straightforward output calls, accessing critical data directly from your firmware has never been easier.
You can investigate your system's internal data without depending on external buses, giving you a unique view of your firmware’s operation. Moreover, the Active-Pro allows for simultaneous debugging of up to four MCUs, making it an invaluable addition to your embedded systems toolkit.
Invest in the Active-Pro Firmware Debugger today and elevate your debugging capabilities to new heights. Say goodbye to the endless hours of troubleshooting and hello to efficient, effective debugging that unleashes your creativity and innovation.
Downloads
Why Engineers Choose The Active-Pro Firmware-Debugger
Mit dem innovativen Active-Pro Firmware Debugger müssen Sie sich keine Sorgen mehr um das Debuggen Ihrer eingebetteten Firmware-Systeme machen. Dieses leistungsstarke Tool wurde entwickelt, um Ihren Debugging-Prozess zu optimieren, sodass Sie sich auf das Wesentliche konzentrieren können – die Entwicklung robuster Firmware-Lösungen.
Der Active-Pro Firmware Debugger bietet ein umfassendes Debugging-Erlebnis mit einer neuen, benutzerfreundlichen Oberfläche, die Ihren Arbeitsablauf vereinfacht. Er bietet klare, präzise Einblicke in die Funktionsweise Ihres Designs, sodass Sie Fehler einfach und effizient erkennen und beheben können.
Zu den Hauptmerkmalen gehören:
- Multiprotokoll-Unterstützung: Active-Pro erfasst und zeigt eine Reihe von Datentypen an, darunter digitale Daten vom Logikanalysator und analoge Daten vom Oszilloskop, und dekodiert problemlos Protokolle wie I2C, SPI und UART.
- Datenstreaming in Echtzeit: Dieser bemerkenswerte Debugger streamt Daten direkt auf die Festplatte und ermöglicht Ihnen das Erfassen und Speichern von Daten für eine dauerhafte Fehlerverfolgung und schnellere Debugging-Sitzungen.
Einer der herausragenden Aspekte des Active-Pro Firmware Debugger sind seine einfachen Verbindungsoptionen. Er verwendet entweder eine 1-Draht- (UART) oder 2-Draht-Schnittstelle (GPIO) und funktioniert nahtlos mit verschiedenen Programmiersprachen wie C, C++ und Python. Mit unkomplizierten Ausgabeaufrufen war der Zugriff auf kritische Daten direkt von Ihrer Firmware noch nie so einfach.
Sie können die internen Daten Ihres Systems untersuchen, ohne von externen Bussen abhängig zu sein, und erhalten so einen einzigartigen Einblick in den Betrieb Ihrer Firmware. Darüber hinaus ermöglicht Active-Pro das gleichzeitige Debuggen von bis zu vier MCUs und ist damit eine unschätzbare Ergänzung Ihres Embedded-System-Toolkits.
Investieren Sie noch heute in den Active-Pro Firmware Debugger und bringen Sie Ihre Debugging-Fähigkeiten auf ein neues Niveau. Verabschieden Sie sich von endlosen Stunden der Fehlersuche und begrüßen Sie effizientes, effektives Debugging, das Ihre Kreativität und Innovation entfesselt.
| General Information | |
|---|---|
Part Number (SKU) |
AP-FD
|
Manufacturer |
|
| Physical and Mechanical | |
Weight |
1.0 kg
|
| Other | |
EAN |
5055383697243
|
Frequently Asked Questions
Have a Question?
-
How does the Active-Pro's Packet Presenter feature enhance debugging efficiency?
The Packet Presenter is an advanced feature that automatically decodes and analyses communication protocols, presenting raw data in meaningful, human-readable formats. Rather than interpreting hexadecimal values manually, engineers can view decoded protocol information including start/stop conditions, read/write operations, register addresses, and extracted data values. The system supports up to 63 graphable packet fields, allowing automatic generation of real-time graphs from decoded protocol data. This feature dramatically reduces debugging time by eliminating manual protocol analysis and providing immediate insights into communication patterns and data content.
-
What types of analogue measurements can the Active-Pro perform?
The Active-Pro includes comprehensive analog measurement capabilities with three configurable analog channels that can be used as either single-ended or differential inputs. The system supports voltage measurements from 0V to 20V (single-ended) or -10V to +10V (differential), with tolerance up to -30V to +30V. Single-ended channels sample at 1Msps with 12-bit resolution, whilst differential channels operate at 200Ksps with 15-bit resolution. A key feature is dynamic current measurement using the differential input, enabling real-time power consumption analysis to identify power-hungry firmware sections or unexpected current draw.
-
How does real-time debugging without code halting benefit embedded system development?
Real-time debugging without halting code execution is crucial for timing-critical applications, real-time systems, and multi-processor environments where stopping one processor could affect the entire system's behaviour. Traditional step-through debuggers can miss critical timing-related bugs and race conditions because they fundamentally alter the system's execution flow. The Active-Pro's non-intrusive debugging approach allows engineers to observe genuine system behaviour, including interrupt responses, communication timing, and inter-processor interactions as they naturally occur. This capability is particularly valuable for debugging issues that only manifest during continuous operation or under specific timing conditions.
-
What makes the Active-Pro more cost-effective than premium debugging solutions like Lauterbach TRACE32?
Whilst premium debugging solutions like Lauterbach TRACE32 can cost tens of thousands of pounds and require extensive training, the Active-Pro provides comparable multi-processor debugging capabilities at a fraction of the cost. Unlike expensive solutions that may require specialised cables, licensing fees for different processor families, and complex setup procedures, the Active-Pro offers a single tool solution with automatic configuration and a user-friendly interface. The Active-Pro's ability to debug four processors simultaneously often eliminates the need for multiple expensive debugging tools, providing exceptional value for development teams working on complex multi-processor systems.
-
Can the Active-Pro debugger work with any microcontroller or FPGA platform?
Yes, the Active-Pro is designed to be processor and FPGA agnostic, working with any embedded platform that supports C, C++, or Python programming languages. The system uses simple 1-wire (UART) or 2-wire (GPIO) interfaces that can be implemented on virtually any processor architecture. This universal compatibility means engineers can use the same debugging tool across different microcontroller families, IDEs, and development environments, making it an excellent choice for teams working with diverse hardware platforms or those who frequently switch between different processor architectures.
-
How does the Active-Pro's sample buffer depth compare to traditional logic analysers?
The Active-Pro offers an exceptional sample buffer depth of over 4 trillion samples, limited only by the available disk space on the connected PC. This massive buffer capacity, combined with proprietary lossless compression technology, enables extended capture sessions that traditional handheld logic analysers cannot match. For example, when capturing 1MHz I2C register reads every 10 milliseconds, the system can record for approximately 383,000 seconds (4.4 days) per gigabyte of storage. This extended capture capability is essential for debugging intermittent issues and long-term system behaviour analysis.
-
What protocols does the Active-Pro hardware bus decoder support?
The Active-Pro features hardware bus decoding at 240Msps for multiple communication protocols. Currently supported protocols include I2C (with automatic signal detection), SPI (with automatic signal detection), UART/ASYNC (with automatic baud rate detection), 1-Wire, MDIO, LIN, CHSI, RS232, and DS101. The debugger also supports the proprietary ACTIVE Debugger interface and EE101 Debugger interface, both with automatic signal detection. Additional protocols are planned for future releases, making it a comprehensive solution for protocol debugging.
-
How many microcontrollers can the Active-Pro debug simultaneously?
The Active-Pro Firmware Debugger can monitor and debug up to four processors or FPGAs simultaneously (designated as channels A, B, C, and D). Each active device can support up to 64 distinct debug channels, providing engineers with unprecedented visibility into multi-processor systems. This capability is particularly valuable for debugging complex embedded systems where multiple processors communicate with each other, allowing developers to observe real-time interactions and data flow between different components on a single, synchronised timeline.
-
What is the Active-Pro Firmware Debugger and how does it differ from traditional JTAG debuggers?
The Active-Pro Firmware Debugger is a revolutionary multi-processor debugging tool that combines real-time firmware debugging, logic analysis, oscilloscope functionality, and hardware bus decoding in a single device. Unlike traditional JTAG debuggers that halt code execution for debugging, the Active-Pro allows firmware to run continuously whilst streaming debug data directly from up to four microcontrollers simultaneously. This unique Active Debug interface enables engineers to output variables, state changes, and custom messages via simple printf statements without interrupting real-time system operation, providing nanosecond-precision timestamps and complete system visibility