
Total Phase, Inc
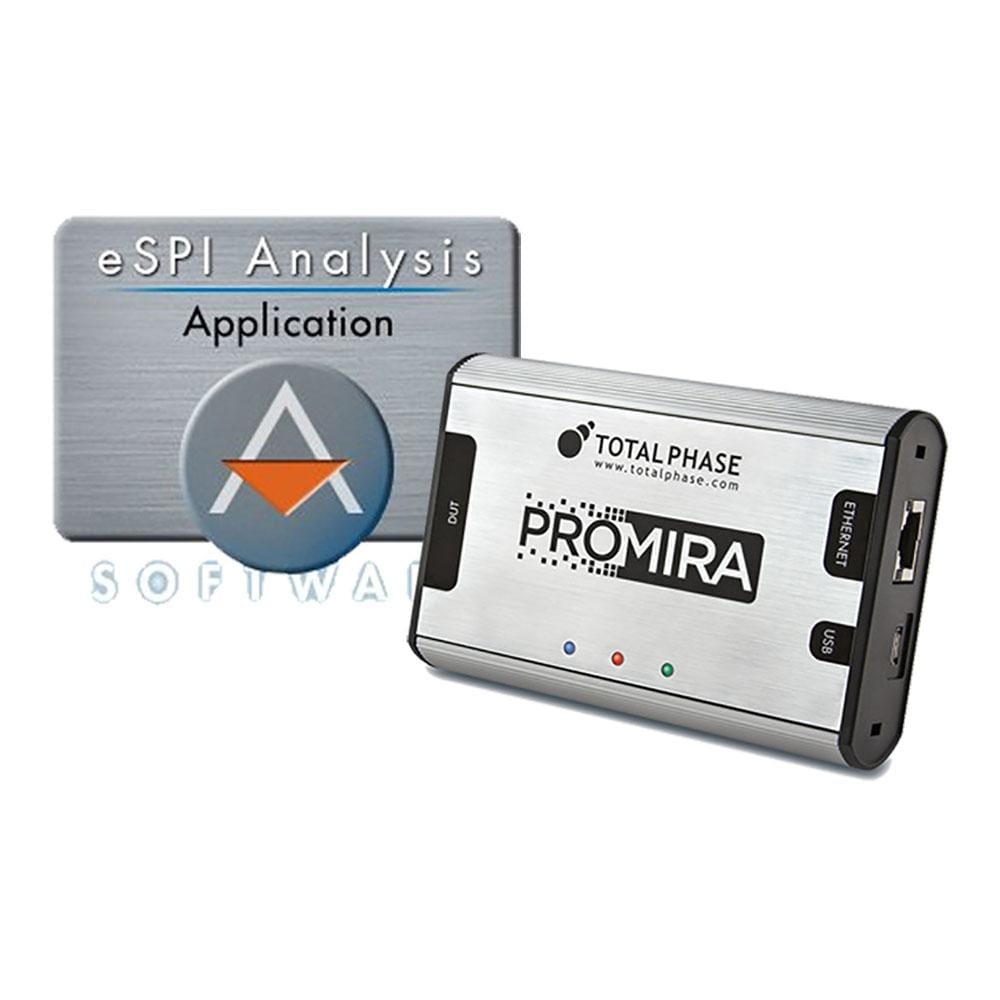
Total Phase PROMIRA eSPI Bus-Analyser-Kit
Total Phase PROMIRA eSPI Bus-Analyser-Kit
SKU: TP601100
Verfügbarkeit für Abholungen konnte nicht geladen werden
Overview
The Total Phase eSPI Bus Monitor includes everything needed to Monitor and Analyse the Enhanced Serial Peripheral Interface (eSPI). The eSPI bus has been developed by Intel.
The eSPI Bus Analyser Kit includes the Total Phase PROMIRA™, a high-performance tool for stimulating and analysing serial buses, an eSPI Analysis, application, and the Data Centre Bus Analyser Software.
THIS PRODUCT IS NOT AVAILABLE FOR DELIVERY TO THE USA
Downloads
Der Total Phase eSPI Bus Monitor enthält alles, was zum Überwachen und Analysieren des Enhanced Serial Peripheral Interface (eSPI) benötigt wird. Der eSPI-Bus wurde von Intel entwickelt.
Der Monitor umfasst Total Phase PROMIRA™, ein Hochleistungstool zum Stimulieren und Analysieren serieller Busse, eine eSPI-Analyseanwendung und die Data Center Bus Analyser Software.
DIESES PRODUKT IST NICHT FÜR DIE LIEFERUNG IN DIE USA VERFÜGBAR
Questions and Answers
-
What Operating Systems Are Compatible with the eSPI Analysis Application?
Windows, Linux and Mac OS X, via the Data Center Software.
-
How Do I Filter or Search for Specific Traffic or Events on the eSPI Bus?
You can use LiveFilter to filter by index, errors, packet type and data patterns, with hardware filters on command values. LiveSearch allows searching for text, hex, or ASCII data to easily locate events.
-
Can the eSPI Analyser Capture and Organize Complex Transactions for Easier Debugging?
Yes. Captured data is shown in a hierarchical tree view, with transactions grouped and expandable for easier navigation.
-
Does the Analyser Support Triggering or Match-action Features for Capturing Precise Conditions?
Yes, the tool has advanced match/trigger options. You can configure triggers for non-posted transactions, errors, or specific data patterns using the Match/Action system.
-
Is There an API for Integrating the eSPI Analyser with Custom Test Setups?
Yes, a 32/64-bit software API is available for C, C#, Python, .NET, and VB.NET, allowing custom integration and automation of tests or analysis tasks.
-
What Is the Total Phase eSPI Analyser, and What Does It Do?
It's a protocol analysis application that runs on the Promira Serial Platform. It non-intrusively captures, displays and monitors Enhanced Serial Peripheral Interface (eSPI) traffic between master and slave devices in real time.
-
Which eSPI Features and Modes Are Supported?
The Analyser supports Single, Dual, and Quad I/O modes, monitoring at speeds up to 66MHz. It decodes eSPI packets by channel and separates the command and response phases.
-
Does the eSPI Analyser Support Real-time Analysis?
Yes. LiveDisplay, LiveFilter and LiveSearch in the Data Center Software let you view, filter and search eSPI traffic in real time as it's captured.

No questions match your search.